Configuring Personalization
On this page
Once you’ve captured user behavior in the form of events, you can configure your Personalization strategy. A Personalization strategy consists of two major components:
- Events
- Facets
For events and facets, you must decide which to include in the strategy and how important each event or facet is relative to other events or facets. These relative weights aren’t cumulative—they don’t need to add up to 100. Instead, they signal relative importance. An event with a weight of 100 is twice as important as an event with a weight of 50. A facet with a weight of 50 is five times as important as a facet with a weight of 10.
After defining your strategy, you need to define the Personalization impact. This configuration is how significant a role Personalization plays in the ranking formula.
When defining each of these, simulating different weights with actual user profiles is key to creating an effective strategy. It’s best to configure and simulate your Personalization strategy using the Personalization section of the dashboard. The dashboard also exposes individual user affinity profiles for inspection in the User tab of this section. The User tab doesn’t display simulated strategies. It displays how profiles are currently built using the saved strategy.
Weighting events and facets for Personalization
When considering your ultimate business goals, not every event and facet is as important as the other. For example, a particular online publication may prioritize time on page as one of their business goals. An ecommerce marketplace may be primarily concerned with total cart size rather than how long customers spend looking at each product detail page. Each goal requires sending a unique set of events and configuring a unique Personalization strategy to personalize results inline with these goals.
Weighting events for Personalization
An ecommerce marketplace with the goal of larger cart sizes may send many events: viewing a product detail or category page, adding a product to a wishlist, adding a product to the shopping cart, and actually purchasing the product, etc. Of these, purchasing a product is probably the strongest indicator for future purchases, followed by adding it to the cart, then adding it to a wishlist, and finally viewing a product detail or category page.
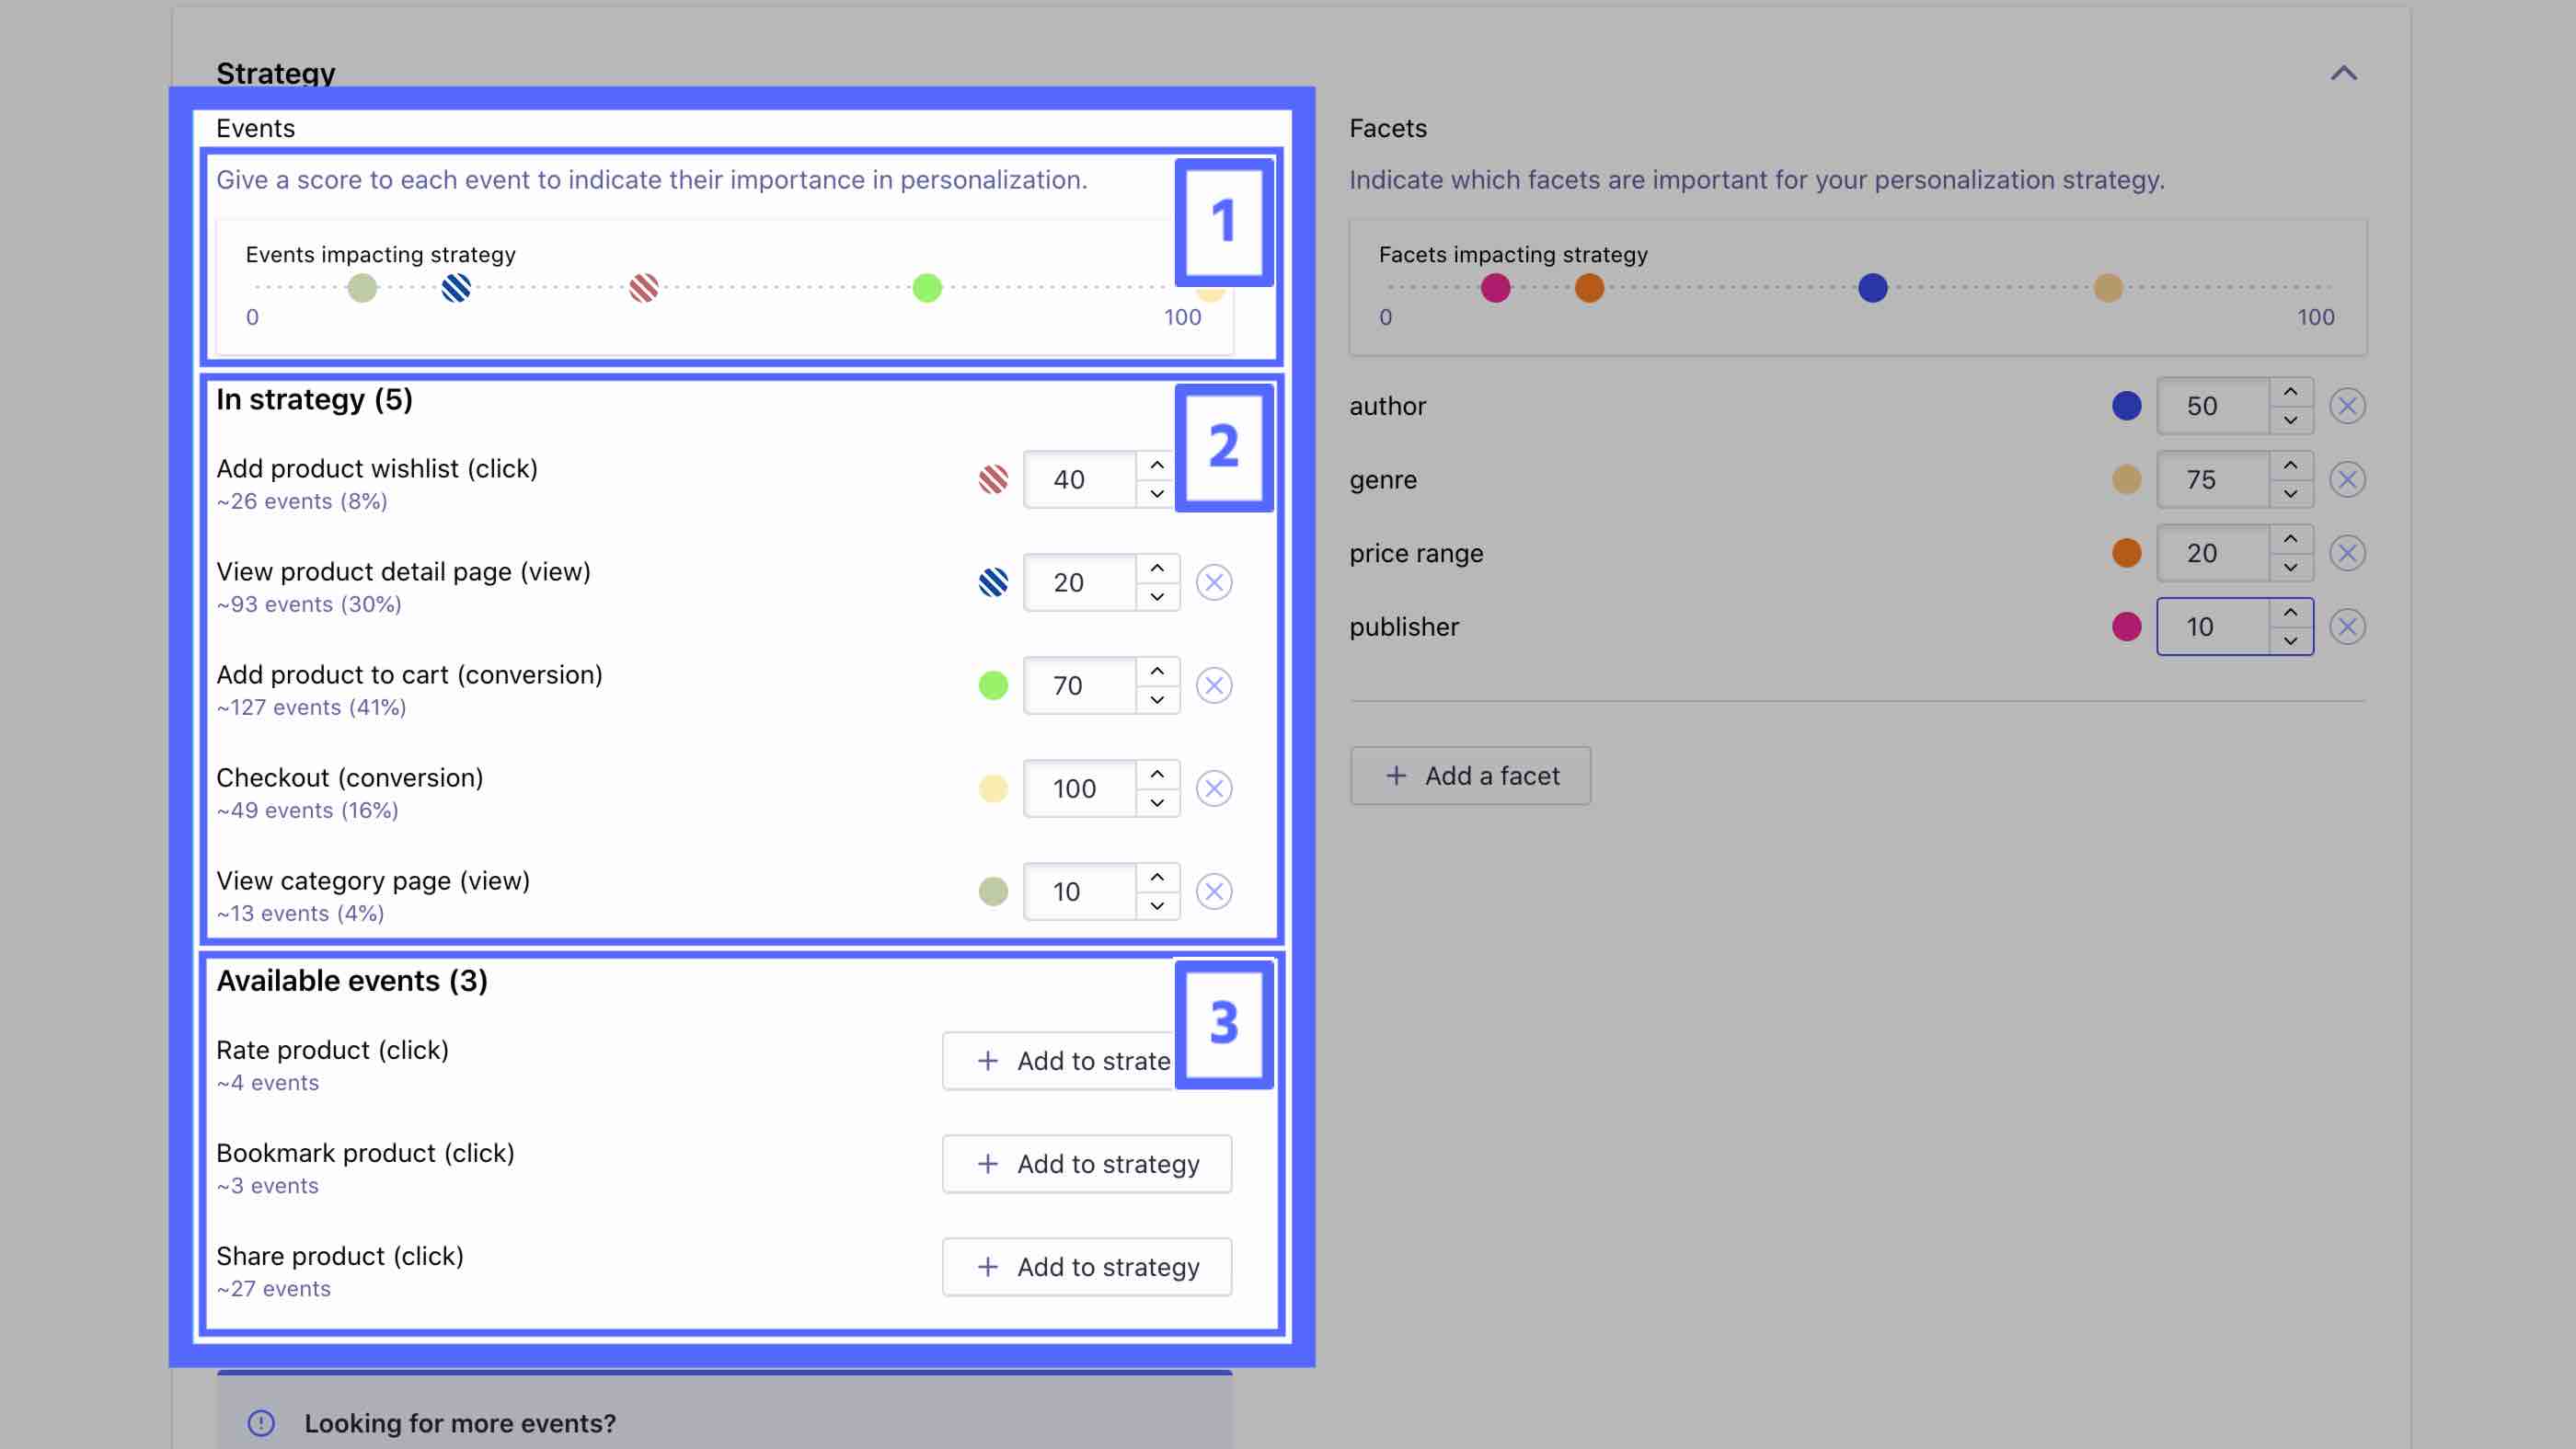
To weight events on the dashboard, navigate to the Personalization section. The Events section has three parts:
- A chart depicting the relative weight of each event on a scale of 1 - 100. This chart is for descriptive purposes. You can’t use it to change weights.
- Events that are In strategy and their respective weights.
- Available events that aren’t in the strategy.
If you don’t see events that you expect to in Available events, please refer to the guides on debugging sending events.
Using the dashboard to weight events
- Scroll to the Events area under Strategy in the Personalization section of the dashboard.
- Add all events you want to include in the strategy by clicking + Add to strategy to the right of the events in Available events. You can add up to 15 events to a strategy. They then appear under In strategy.
- Set the events’ weights by entering a number 1 - 100 in the input to the right of each event.
- Before saving, simulate the strategy using the Simulator below.
- If you need to, change weights or remove events by clicking the
Xbutton to the right of an event’s weight. - Once you’ve verified that the events and respective weights give good results, you can configure your facets for Personalization. If you’ve already configured your facets and aren’t planning on making any changes, click Save settings on the screen’s bottom right.
In the earlier marketplace example, you might give the events the following scores:
- Buy product (Checkout) - 100
- Add product to cart - 70
- Add product to a wishlist - 40
- View product detail page - 20
- View category page - 10
These scores signify that purchasing a product is five times stronger than viewing a product detail page and ten times stronger than viewing a category page. When Algolia receives one of these events, the engine uses the underlying facets to update the relevant user affinity profile.
Weighting facets for Personalization
Though events are the primary mechanism for learning about a user’s affinities, those affinities are expressed through the facets underlying the item or category acted upon in an event. For example, if purchasing a product is an event included in the strategy, the engine looks at the facets of products bought by a particular user to build their user affinity profile.
For instance, if a user in a media store buys a book, you could consider many facets: genre, author, publisher, rating, stock status, price range, publish date, format (hardcover vs. paperback), etc. You’ve declared each of these as attributesForFaceting so that users can filter on them in the UI. That doesn’t mean you should include them all in the Personalization strategy.
Of these attributes, genre and author are probably the best indicators of a user’s affinities, while publisher, and stock status may be the least. Users tend to prefer certain authors, but they probably pay less attention to the publisher. The publish date can distinguish users that prefer newer books versus those who prefer older editions or don’t have a preference. In summary, you can rank the facets like this:
- genre, author: strong indicators of user affinity
- publish date: moderate indicator of user affinity
- publisher, stock status: weak indicators of user affinity
It’s best to use a conservative number of facets for Personalization. You should only include a facet in your Personalization strategy if you are confident it signifies user affinities with regards to your ultimate business goals. With this in mind, you should start by including only the strong indicators (genre and author) to your Personalization strategy. Later, if you find that moderate indicators improve objective metrics, you can include them as well.
You can set facet weights using the Personalization section.
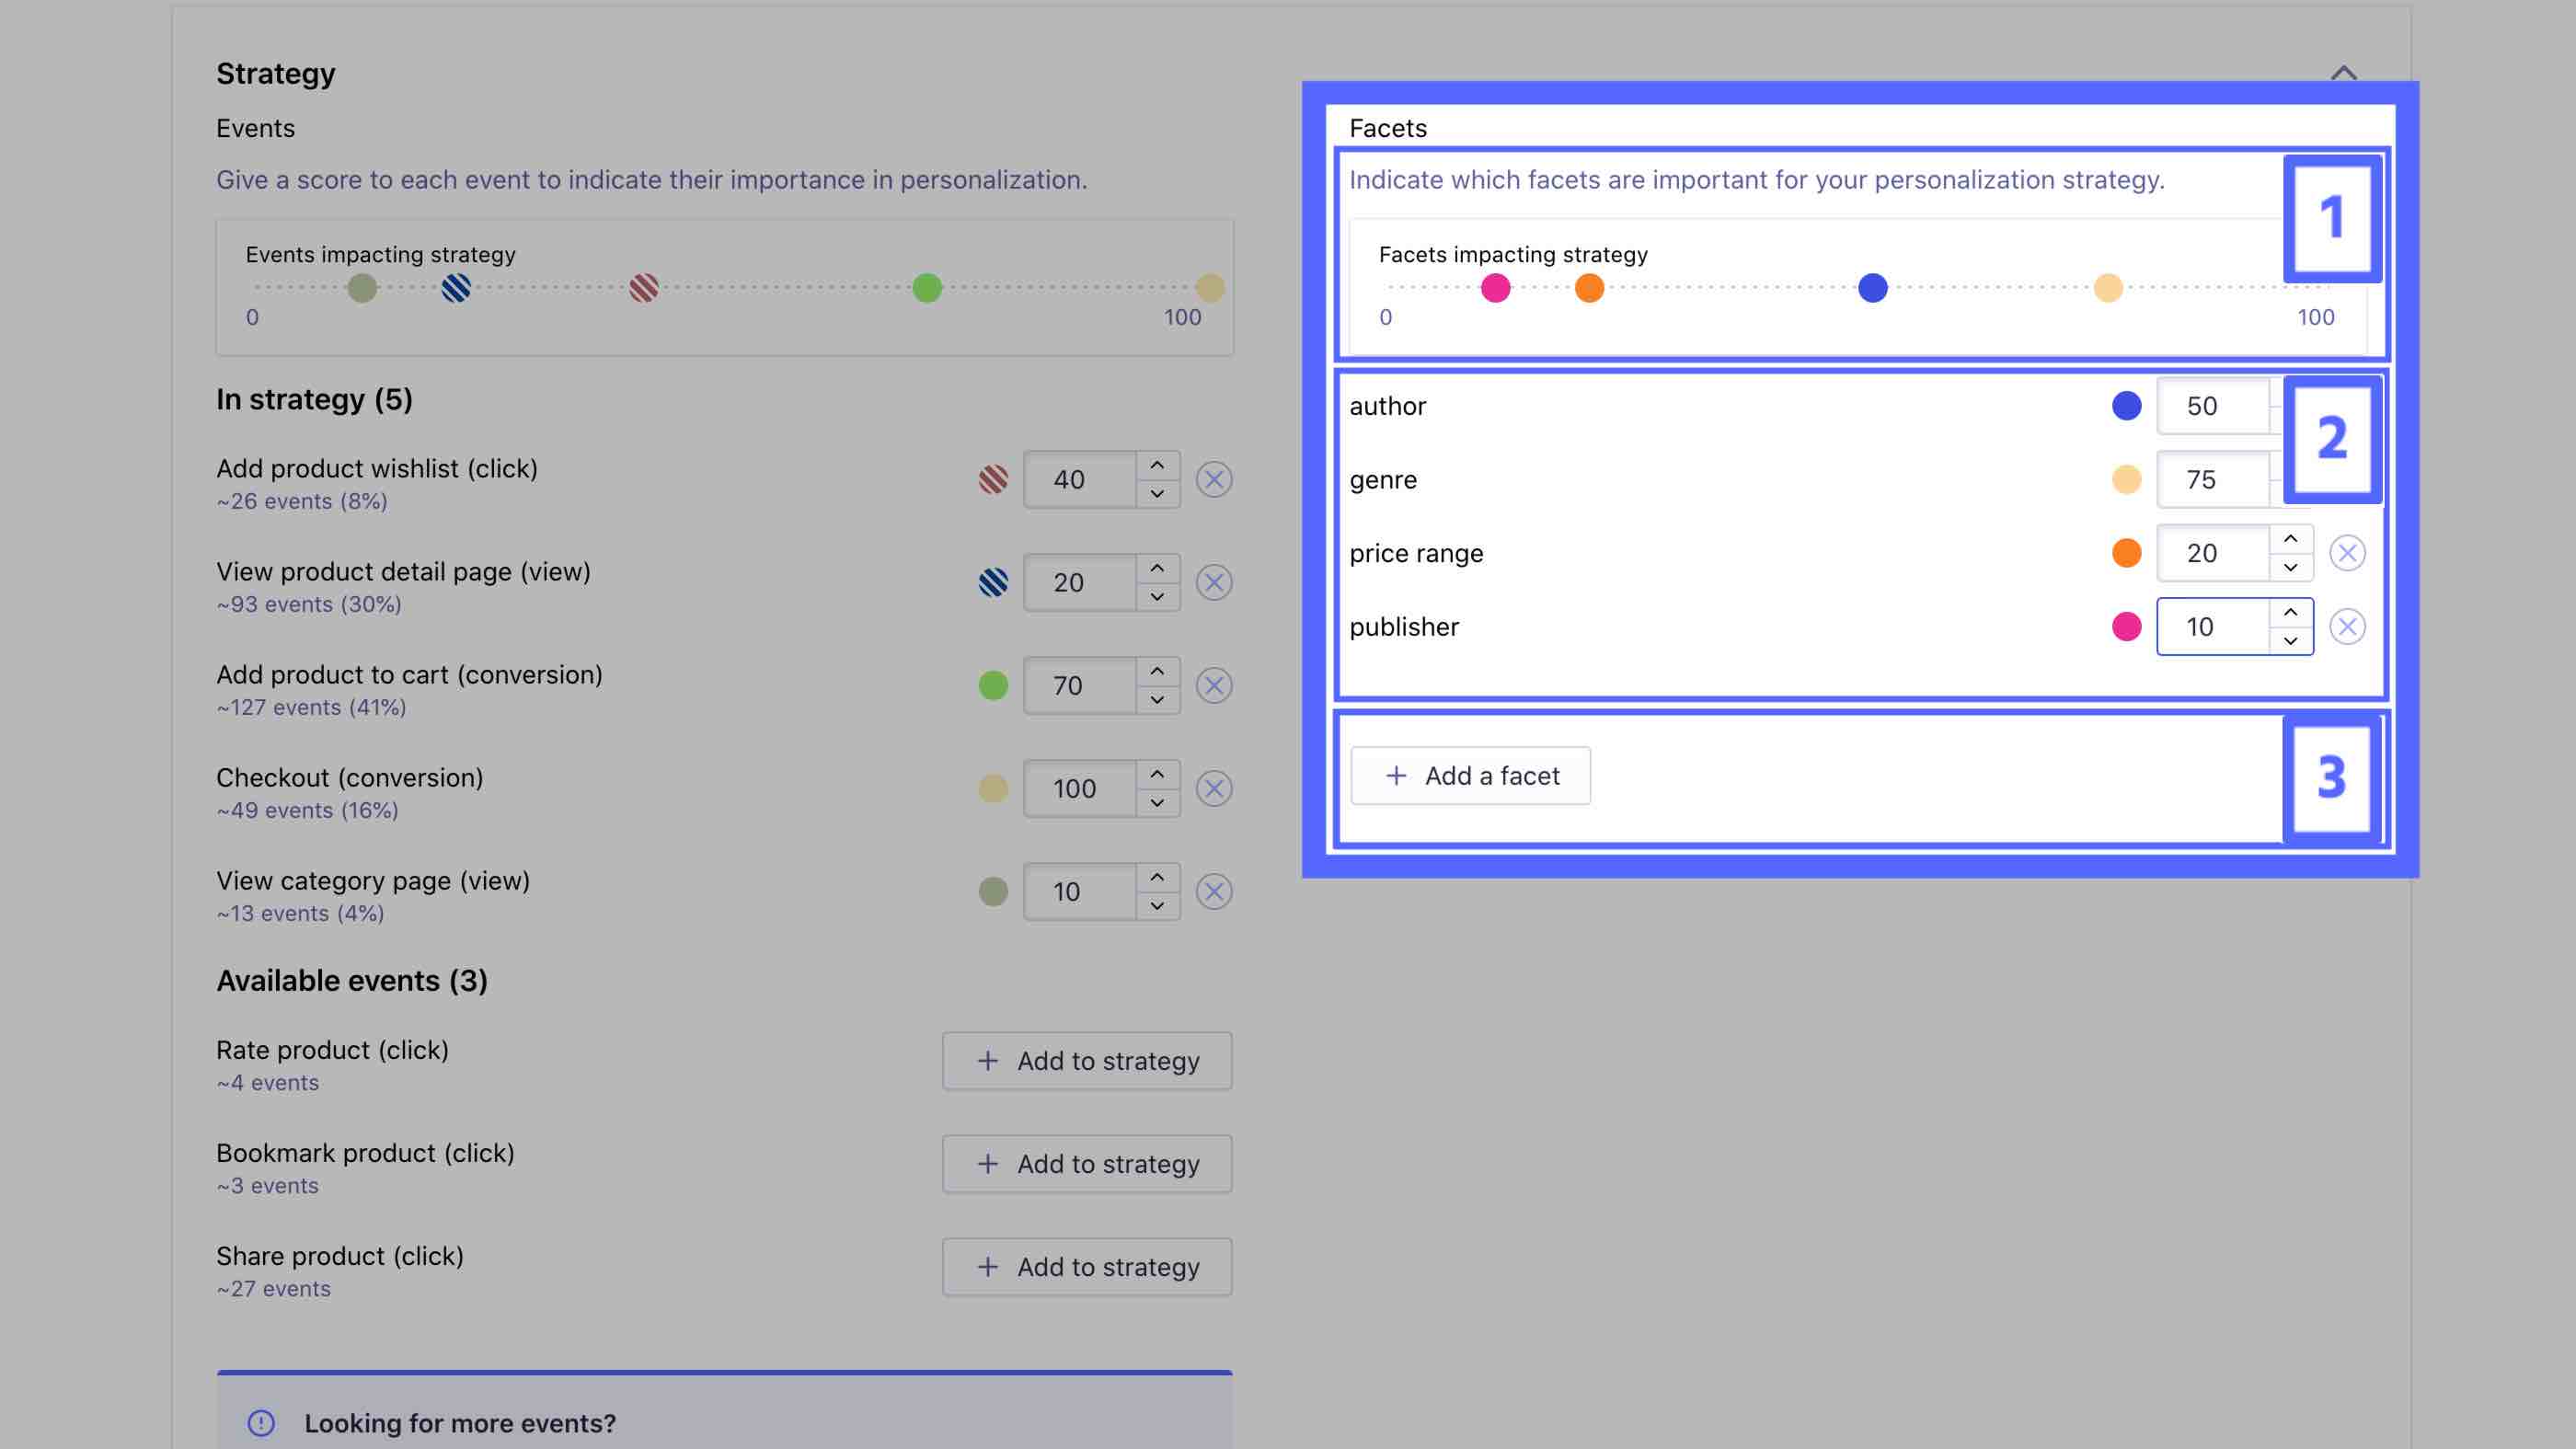
Like Events, the Facets section has three parts:
- A chart depicting the relative weight of each facet on a scale of 1 - 100. This chart is for descriptive purposes only. You can’t use it to change weights.
- Facets included in the strategy and their respective weights.
- An + Add a facet button to add more facets to the strategy.
If you don’t see facets that you expect in the modal that appears when you click + Add a facet, please ensure that you’ve declared the attribute in attributesForFaceting.
Using nested attributes as facets for Personalization
To use nested attributes as facets for Personalization, you must declare them explicitly as attributesForFaceting. For example, suppose you have a categories attribute, with different nested categories:
1
2
3
4
5
6
7
8
 {
   // other record attributes
   "categories": {
     "genres": ["Rock", "Pop"],
     "similar_artists": ["Elvis Presley", "Buddy Holly"]
     // other nested attributes
   }
 }
To use categories.genres or categories.similar_artists as facets for Personalization, you need to explicitly declare them, and not just categories, as attributesForFaceting. Once you’ve declared all desired attributes as attributesForFaceting, weighting facets is similar to weighting events.
Using the dashboard to weight facets
- Scroll to the Facets area under Strategy in the Personalization section of the dashboard.
- Add the facets you want to include in the strategy by clicking + Add a facet. A modal will appear where you can:
- Select the index where you’ve declared the attribute in the
attributesForFaceting. - Enter the attribute name. Click confirm when you’re done.
- Select the index where you’ve declared the attribute in the
- Repeat this for each facet you want to include in the strategy. You can add up to 15 facets to a strategy.
- Set the facets’ weights by entering a number 1 - 100 in the input to each facet’s right.
- Before saving, simulate the strategy using the Simulator below.
- If you need to, change the weights or remove facets by clicking the
Xbutton to the right of a facet’s weight. - Once you’ve verified that the facets and respective weights give good results, you can configure your events for Personalization. If you’ve already configured your events and aren’t planning on making any changes, click Save settings on the screen’s bottom right.
In the media store example, you might start by giving the facets the following scores:
- genre - 75
- author - 50
Others, such as stock status, you can leave off entirely. If you find that including publish date improves the strategy, you can add it to the strategy later:
- genre - 75
- author - 50
- publish date - 20
Defining Personalization impact
Personalization doesn’t replace Algolia’s ranking algorithm; it becomes part of it. The Personalization impact lets you define how big a part.
More specifically, the Personalization impact controls the relative position boost that user affinities can have on the search results ranking. For example, consider an item in the tenth position in a list of search results without Personalization. Suppose the item has matching values to a user’s affinity profile for facets that you’ve weighted strongly. The Personalization impact determines how high to boost the item—to the fifth position, the second, or potentially even to the top of the results.
Understanding Personalization impact
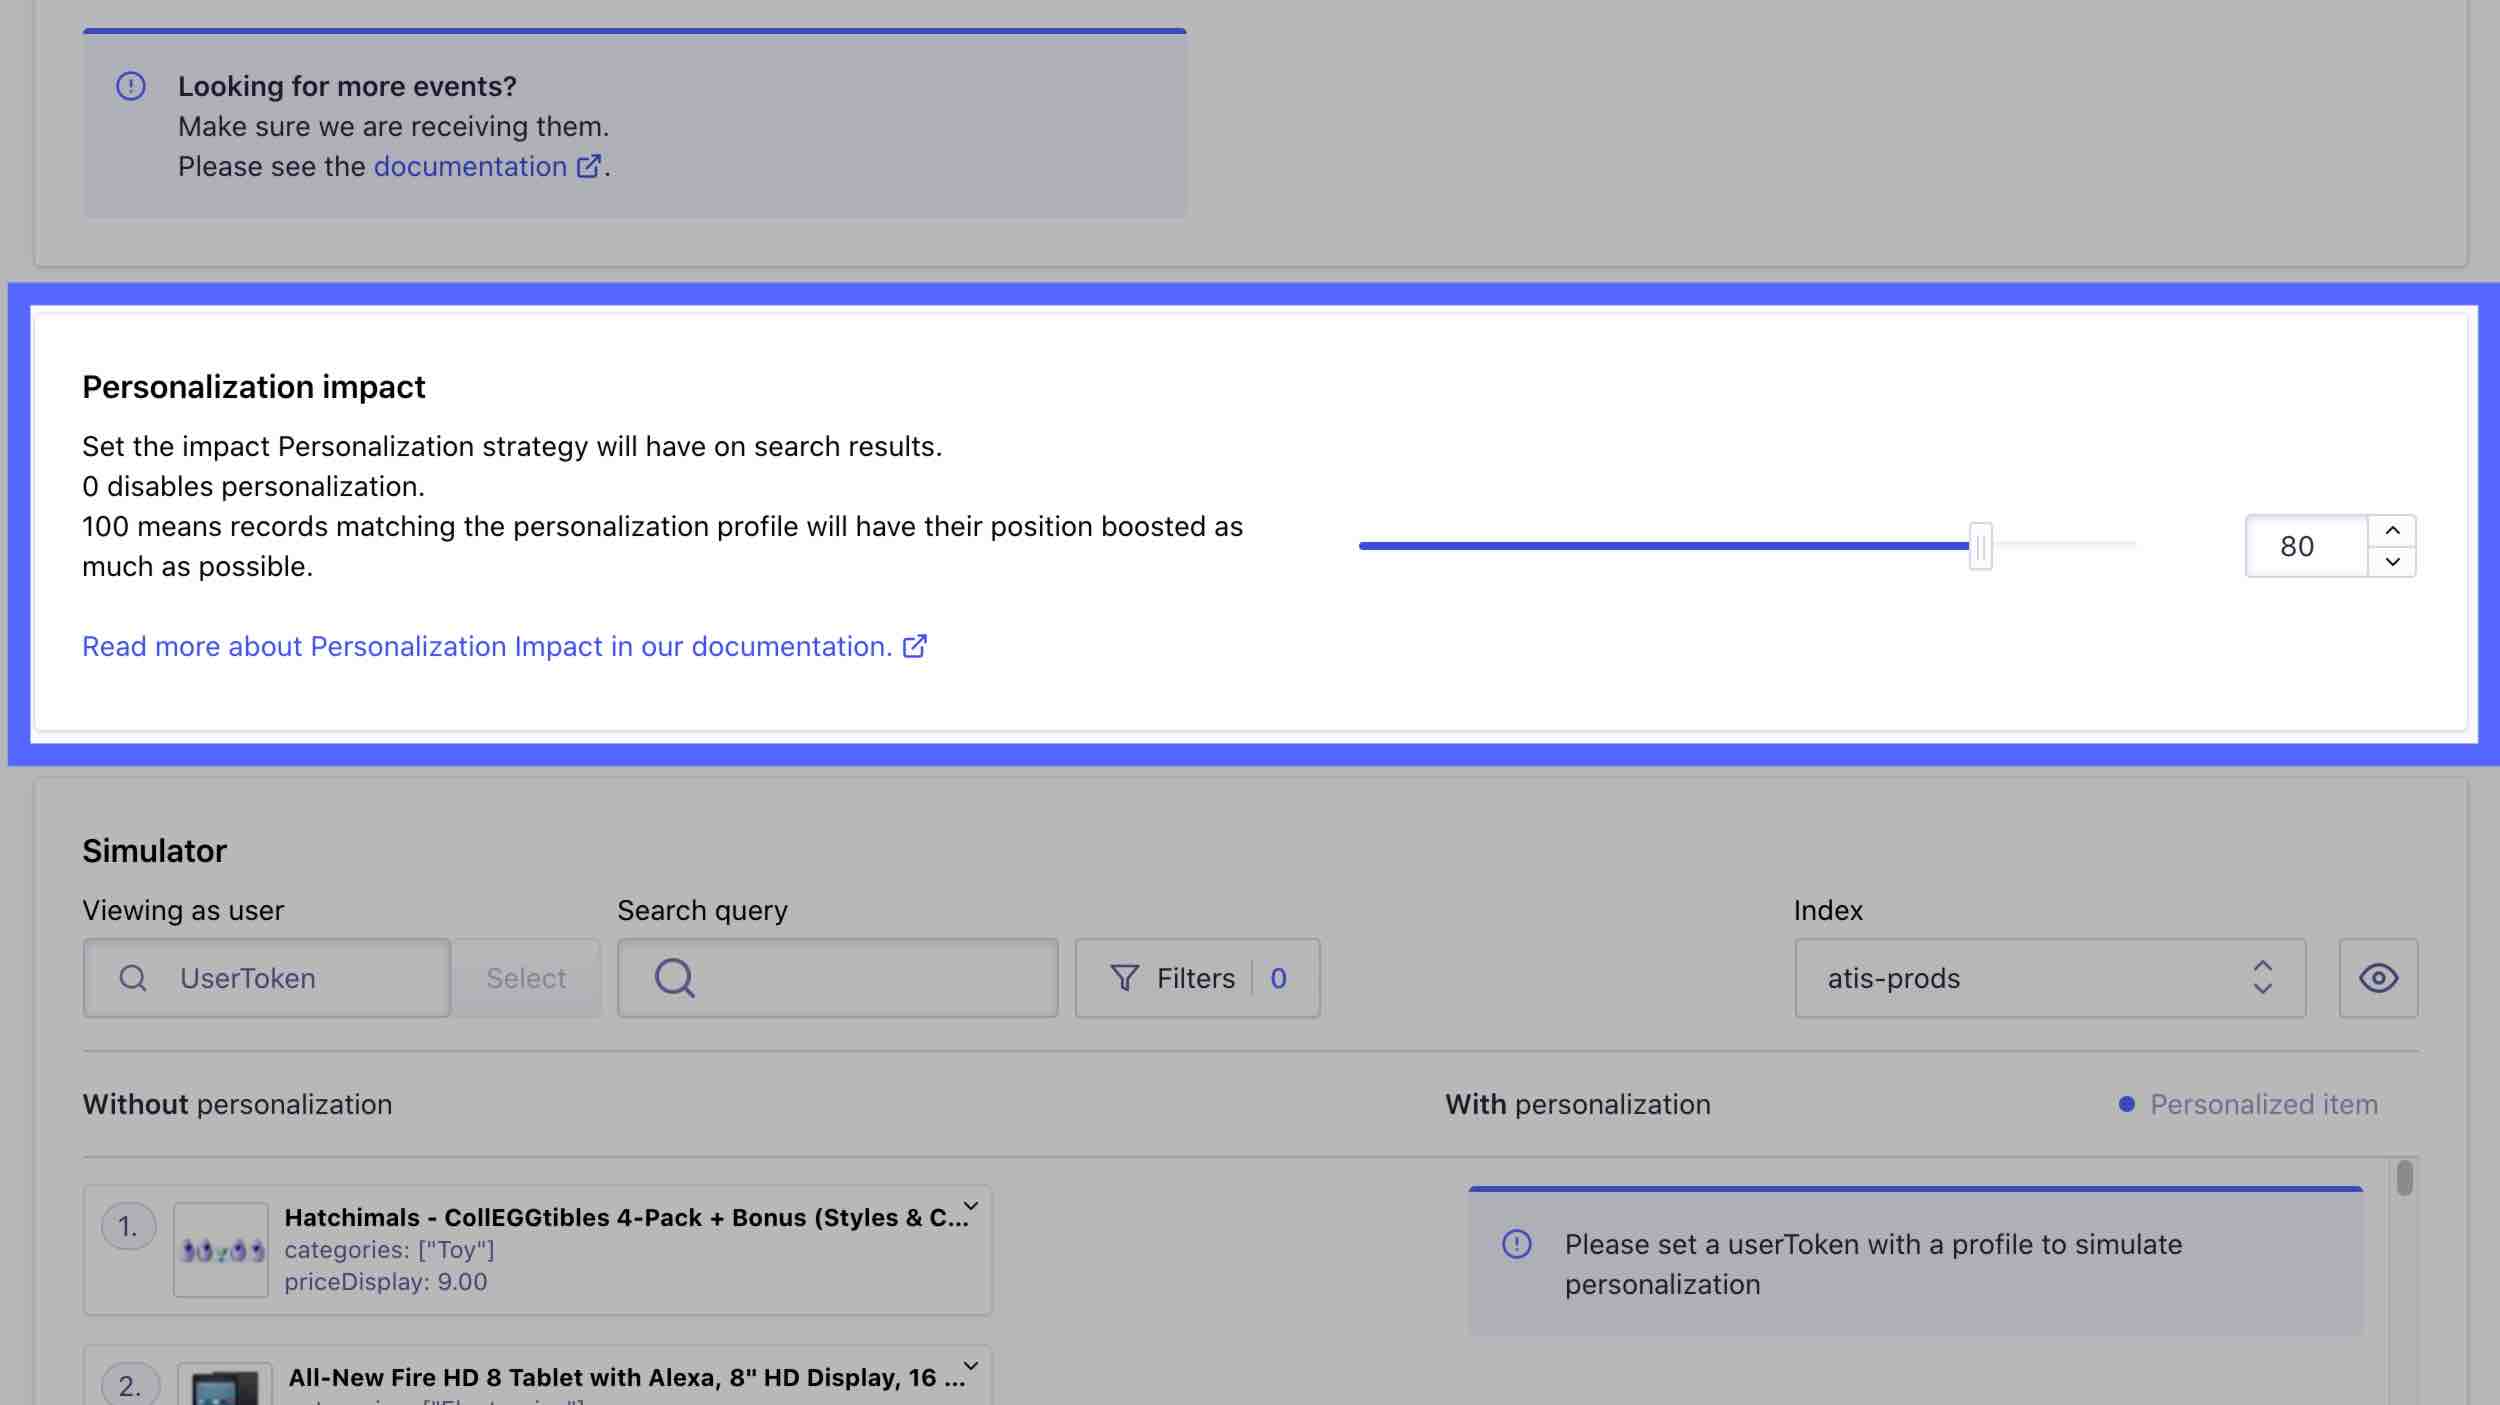
The Personalization impact can be any integer value between zero and 100.
-
When Personalization impact is zero, this is the same as disabling the feature. Personalization plays no role in the ranking.
-
When Personalization impact is 50, the feature has a medium impact on ranking. If two results have the same textual relevance but facet values with differing user affinities, the one with facet values that match user affinities can appear at a position up to two times higher than the result with no matching user affinities.
-
When Personalization impact is 100, the impact is at its highest. That doesn’t mean that the engine personalizes all results, nor does it mean that Personalization takes over the ranking formula. However, it does mean that the engine prioritizes Personalization over business relevance, that is,
customRanking.
Using the dashboard to define Personalization impact
- Scroll to the Personalization impact area in the Personalization section of the dashboard.
- Toggle the slider or enter a weight 1 - 100 in the input to the right of it.
- Before saving, simulate the strategy using the Simulator below.
Changing the Personalization impact doesn’t affect the ongoing capturing of events nor the calculation of user affinity profiles. It only affects whether, and by how much, Algolia applies user affinity profiles during the ranking process.
Simulating Personalization
Each time you edit the events, facets, or Personalization impact in your strategy, it’s best to simulate the effects of the changes before saving. You can do this using the Simulator in the Personalization section of the dashboard.
Though you may know that a particular event or facet should have a higher weight than another, the simulator lets you fine-tune the scores by personifying users and ensuring the personified results are as you would expect. You can also test the effects of multiple changes together using the simulator.
Understanding the dashboard Personalization simulator
The simulator has two main sections. You can use the top section to configure simulation settings, including:
- The user you are simulating results for,
- The search query, including filters, you are simulating results for,
- The index to search,
- Display settings—which attributes to display in the Simulator results below.
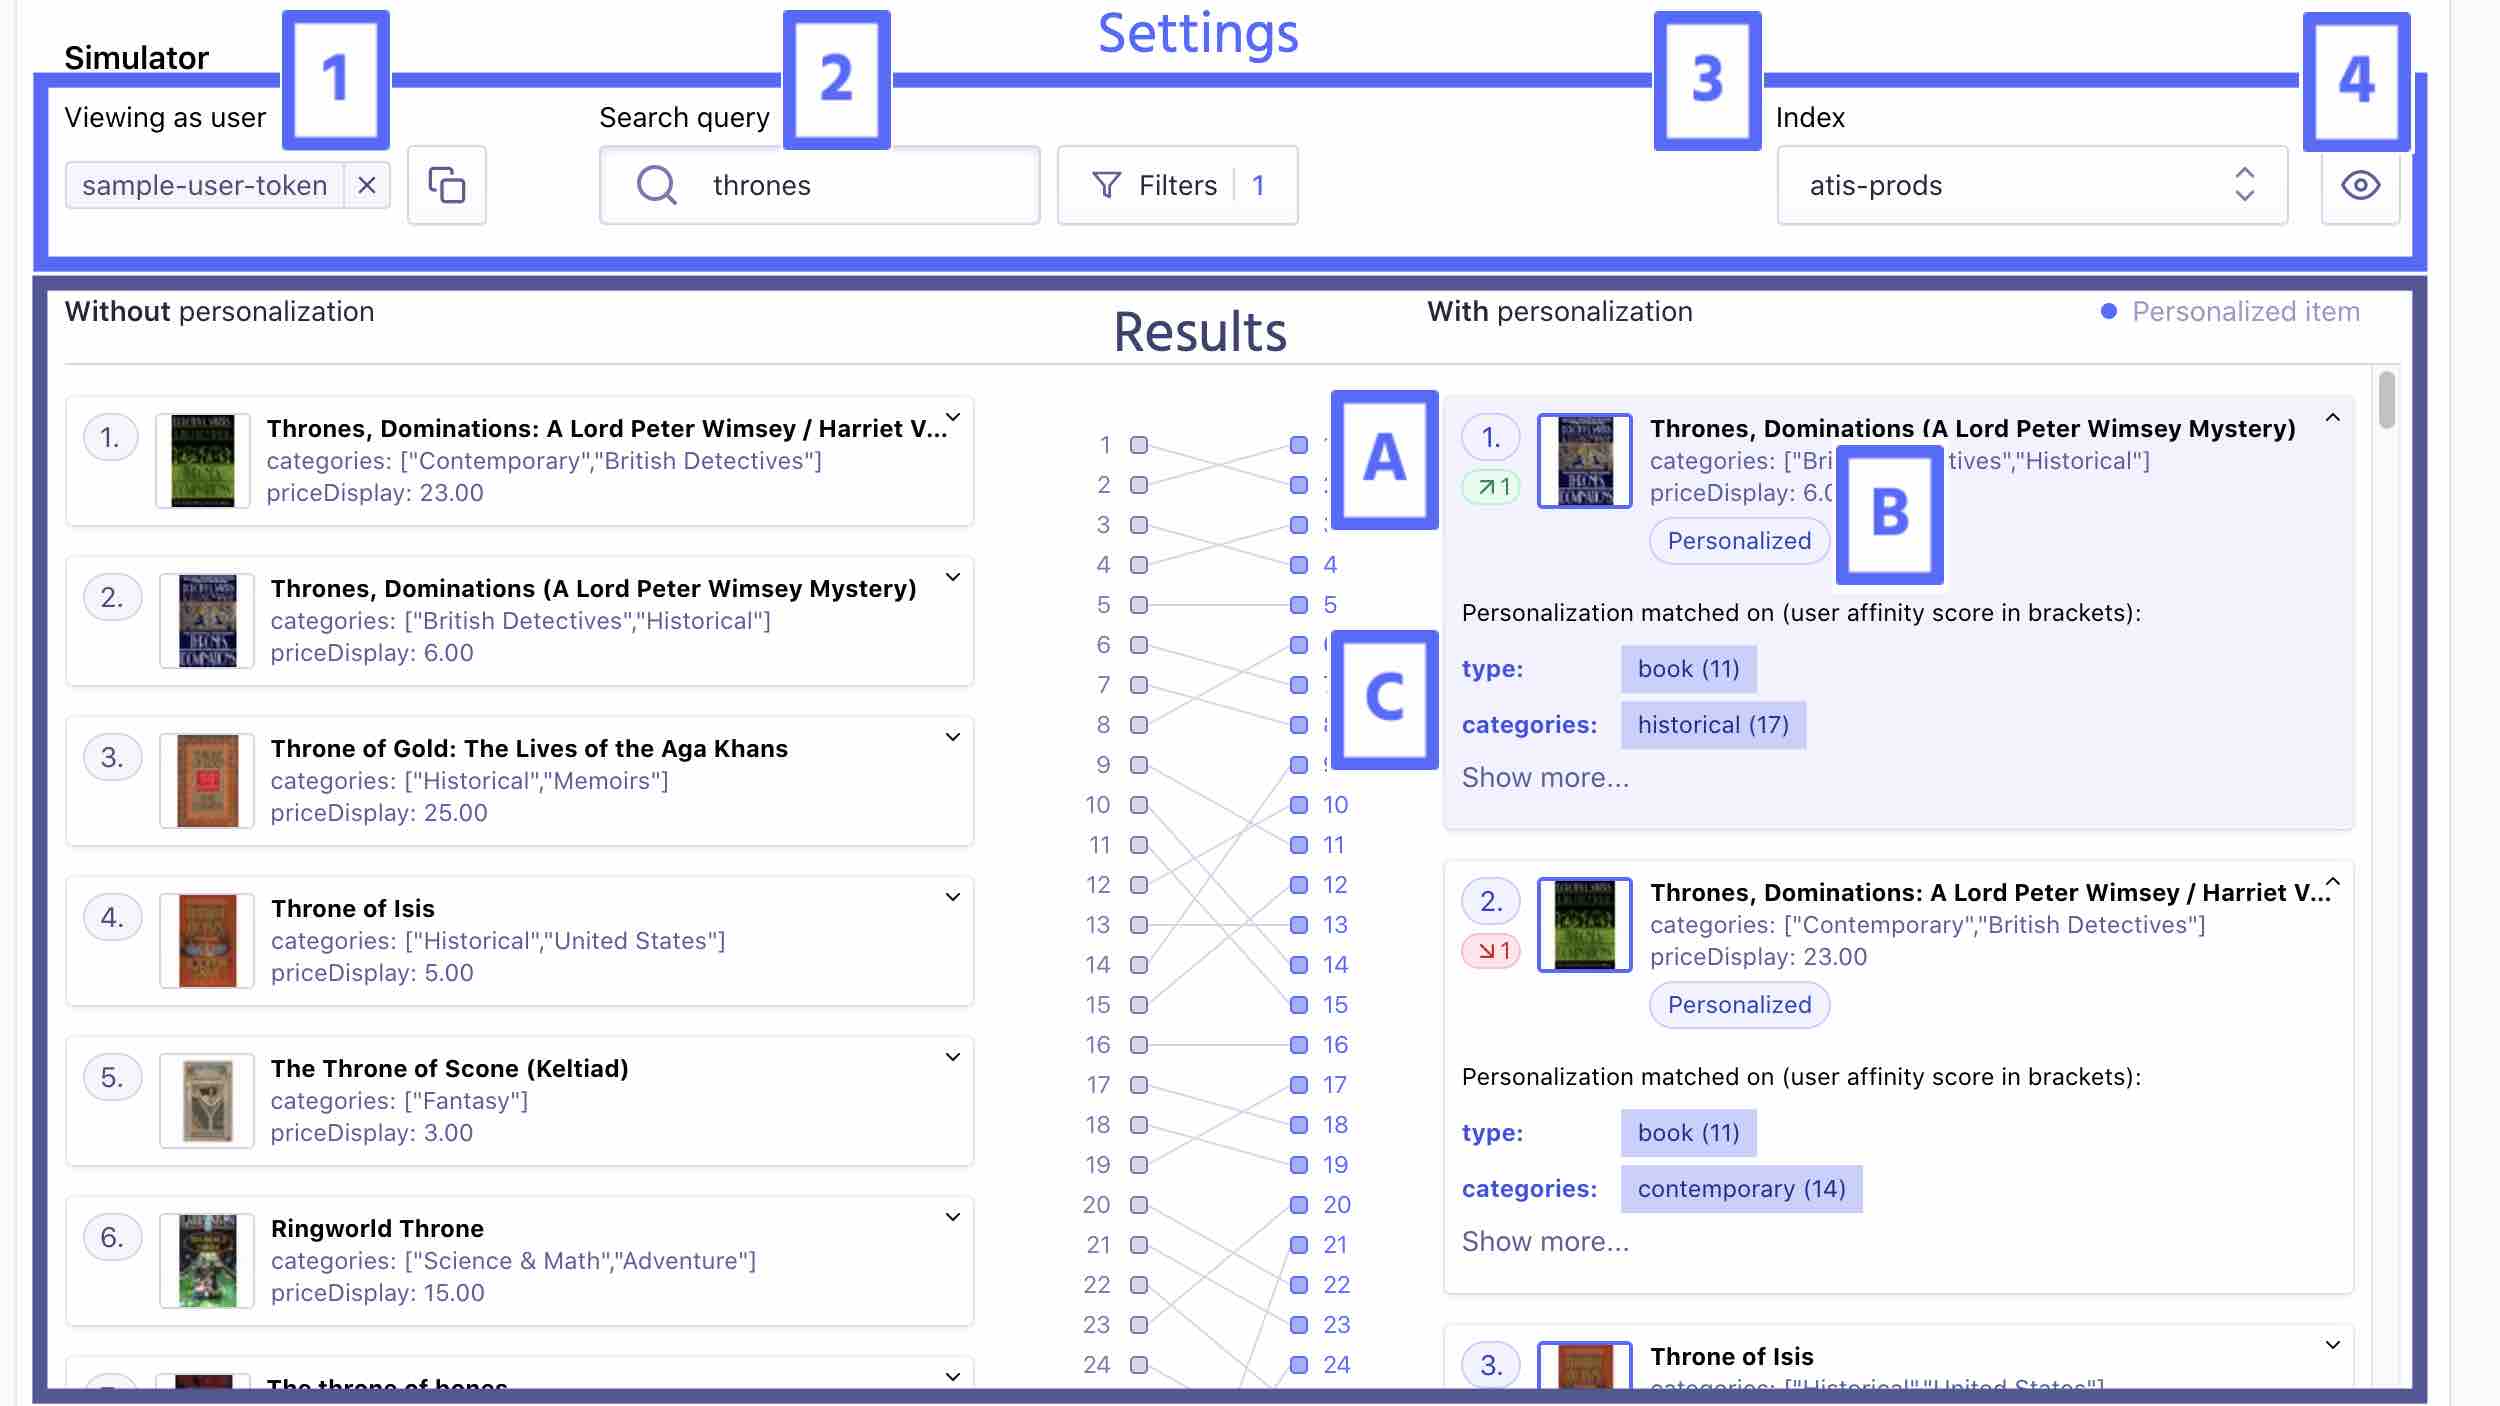
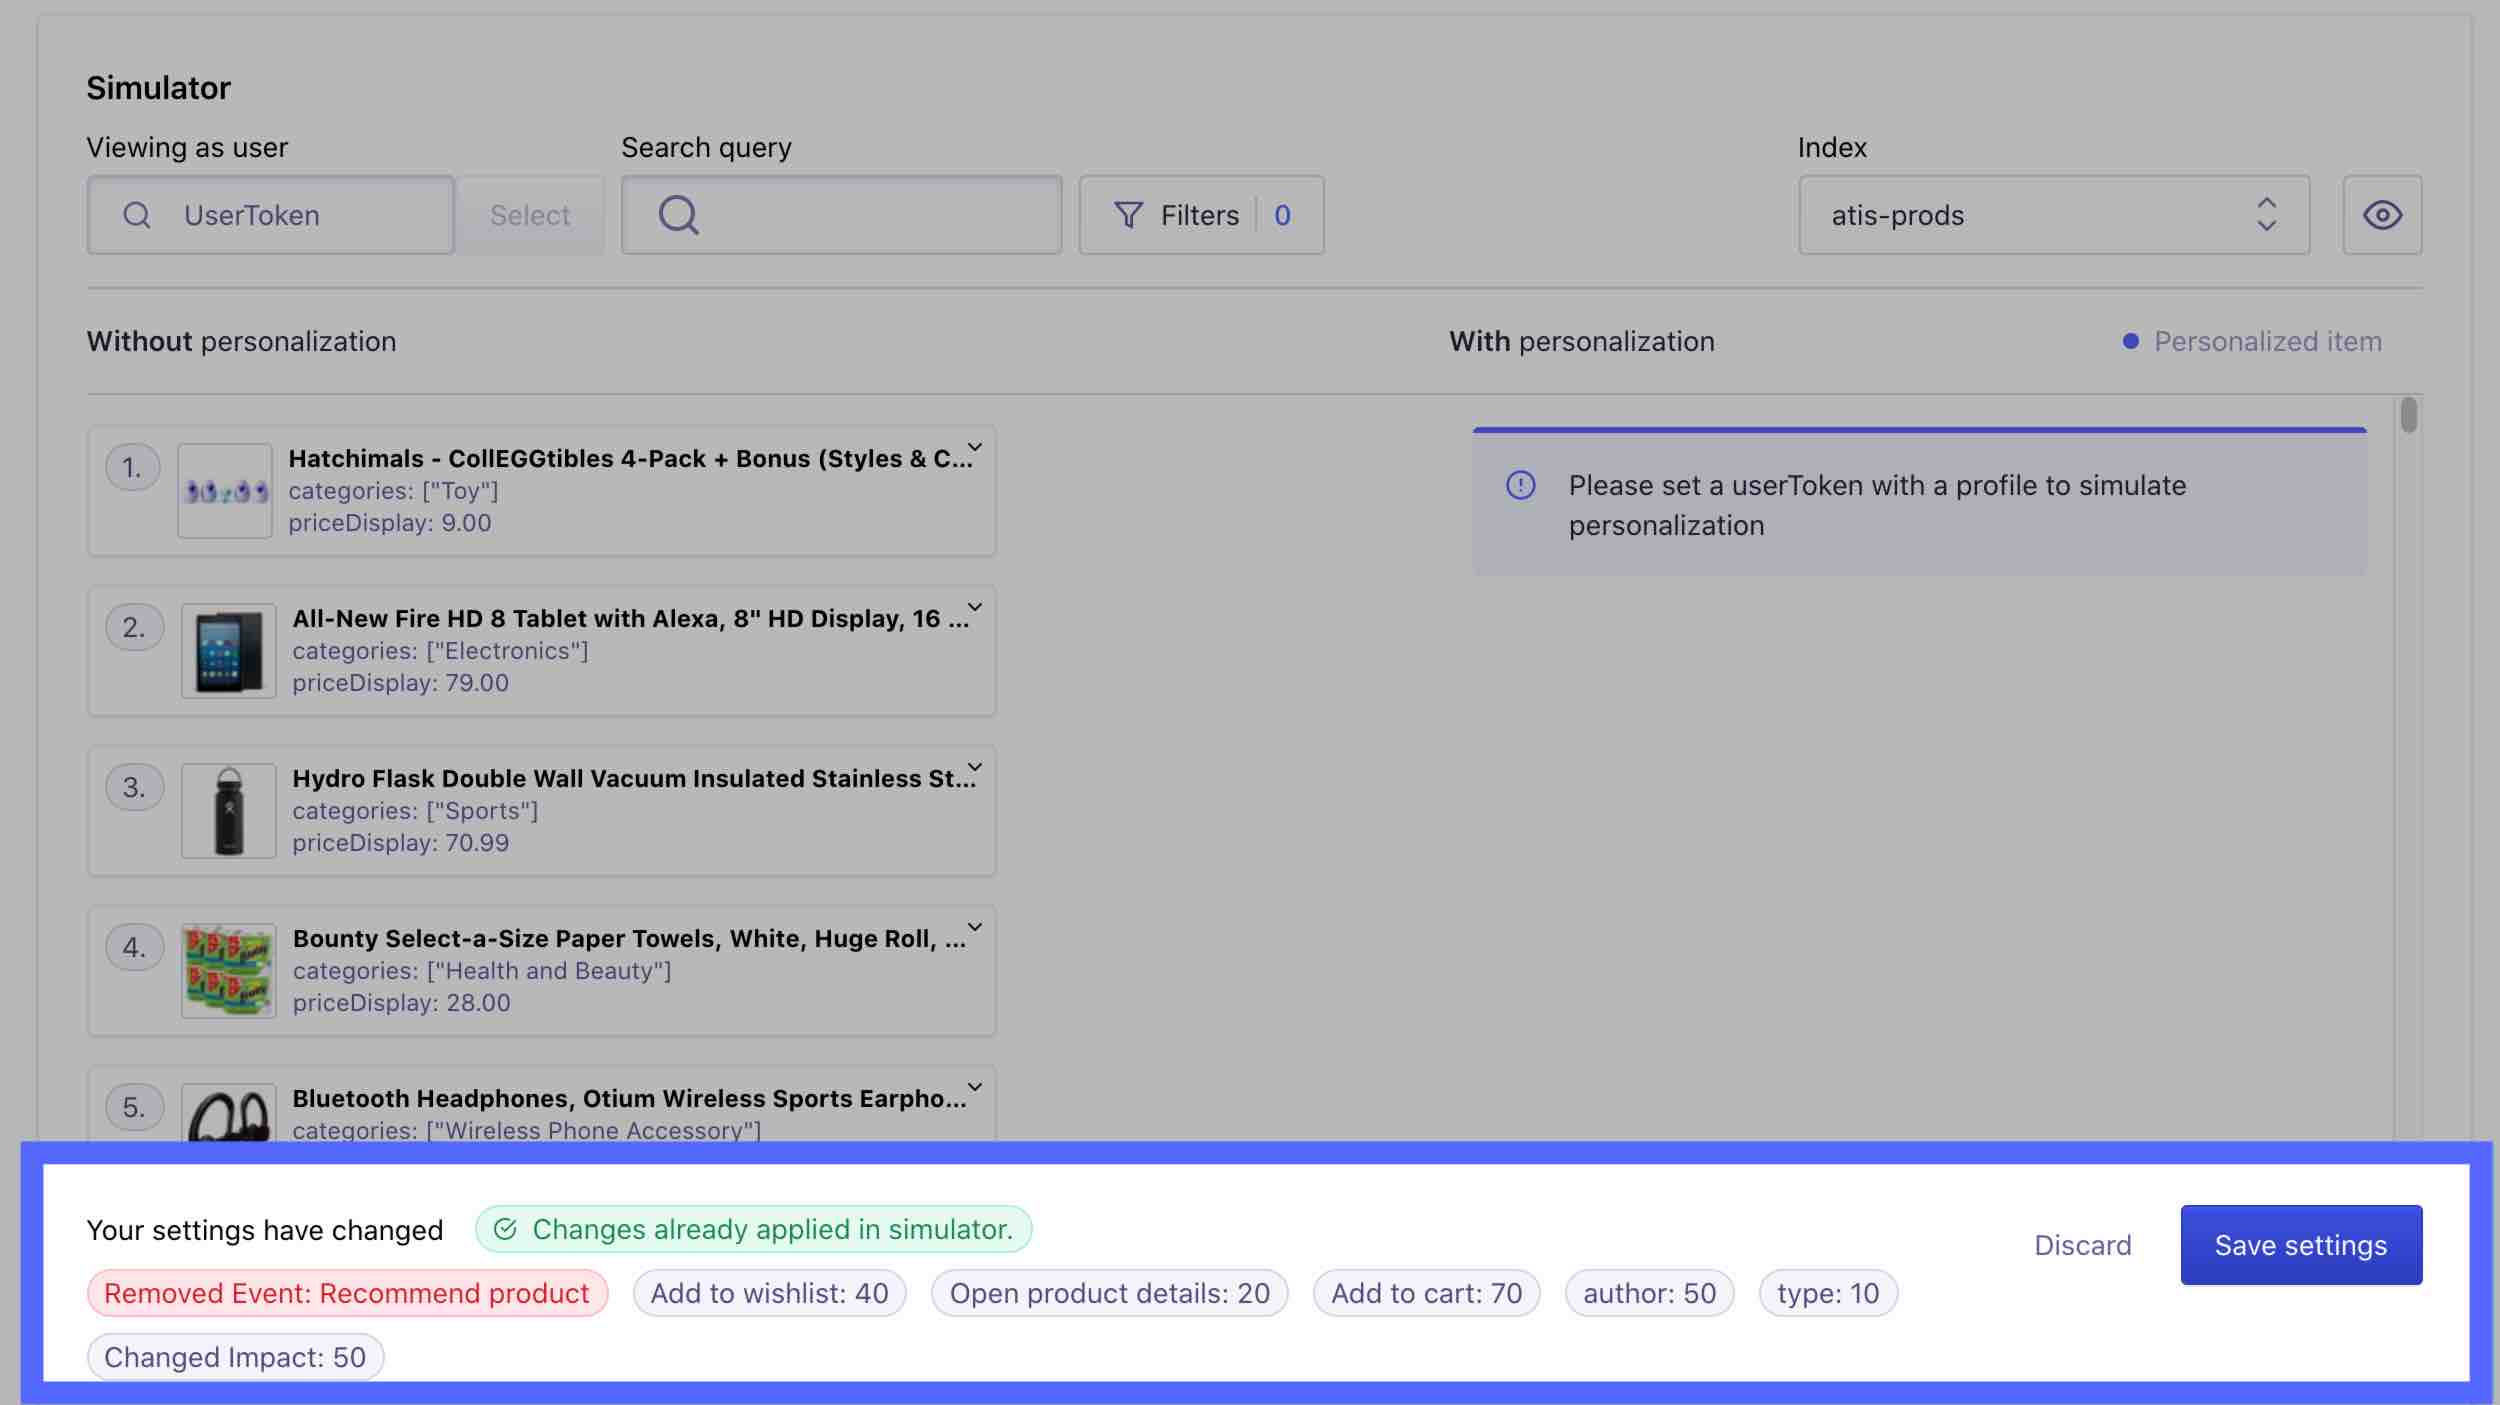
The larger bottom section displays the results for the user, search query, and index you selected in the settings.
For comparison, the left column shows results without Personalization, and the right column shows personalized results. Between the two columns, the simulator shows where results from one column appear in the other column. In the earlier example, you can see a line from position one on the left to position two on the right. That means that the first hit in the results without Personalization is in the personalized results’ second position.
Each result in the right column has some additional information.
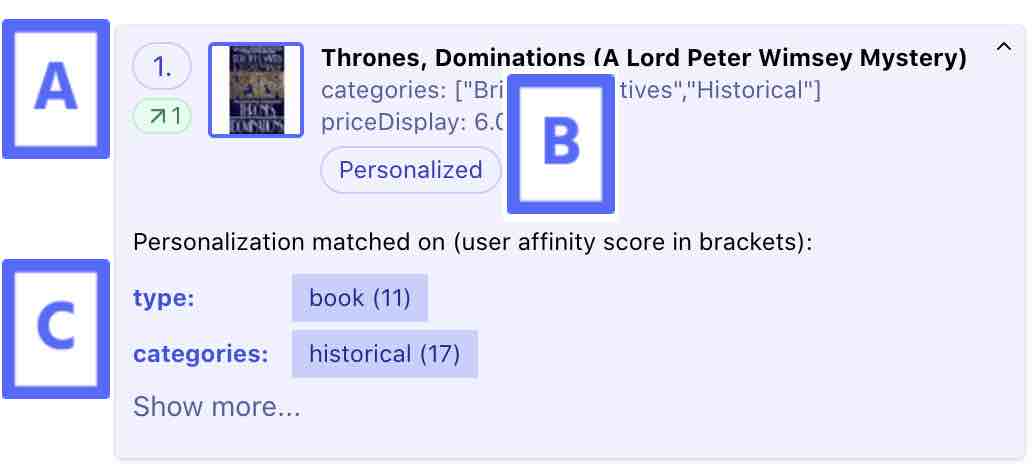
A. The simulator displays the position number of the result in the top left corner. If Personalization changed the result’s position, another number appears below the position number. If the result has the same position with and without Personalization, the simulator displays -.
If Personalization boosted the result, the number of positions it moved up appears in green next to an ↗ arrow. If a result’s position is lower, the number of positions it moved down appears in red next to an ↘ arrow. If Personalization boosted the result from an original position lower than 200, the simulator displays a double ↗ arrow without the number of positions the result moved.
In the earlier example, Personalization boosted the result one position higher, from second place in the results without Personalization to first place in the personalized results. Therefore, below 1. (the absolute position), the simulator displays ↗ 1 to indicate it moved up one position due to Personalization.
B. If Personalization played a role in the result’s position, the simulator displays Personalized underneath the result’s display attributes. You can click this button to reveal which facets values were involved.
C. If you’ve revealed the facet values, the simulator displays the particular user affinity score for each facet value that affected Personalization.
In the earlier example, the result has the facet values type:book and categories:historical. The personified user has shown an affinity for these values through earlier behavior included in the Personalization strategy as events. For example, they may have previously clicked on or bought an item with these facet values.
The result just below it has type:book and categories:contemporary. Since categories:historical has an affinity score of 17 and categories:contemporary has an affinity score of 14, the historical book was boosted to the first position, though they have the same textual and business relevance. Algolia computes these affinity scores using the events, facets, and respective weights you’ve included in your strategy.
For example, the user may have added a contemporary book to their shopping cart but never actually bought it, while they did buy a historical book. Assuming you’ve set a lower weight for the “Add product to cart” event than the “Buy product” event, this explains the lower affinity score for categories:contemporary as compared to categories:historical. Accordingly, given the same textual relevance, Algolia boosts results with categories:historical over results with categories:contemporary.
Using the dashboard Personalization simulator
As soon as you make a change to your strategy, including the Personalization impact, a notification appears at the bottom of the screen. This notification lists the changes and alerts you that the Changes are already applied in the simulator. That means you’re ready to start simulating searches.
If you haven’t made any changes to the strategy, you can use the simulator to simulate searches for the current strategy.
- Scroll to the Simulator area in the Personalization section of the dashboard.
- Select the user you want to simulate personalized results for. The simulator suggests some recently used
userTokens in a dropdown when you click on the user input, but you can also search for one you have in mind. It’s best to select a user you know the general affinities for to ensure that the computed profile corresponds as you would expect. - Optionally, input a search query to simulate. If you don’t input a query, you’ll see the results of an empty search. You can also optionally set filters. For example, if you power your category pages using Algolia, you can simulate a personalized category page by inputting the corresponding filter.
- Select the index to query.
- Click on Set up display preference button to choose which attributes to use as titles, labels, and images in the results below. The simulator provides some defaults but encourage you to display results similarly to your website or application. This way, you can better simulate your users’ experience and more easily identify if the results are as expected. You can also display attributes that you may not show to your users but are essential for understanding ranking. For example, if you use profit margin as a
customRankingbut don’t display it to your users, you may want to include it in the simulator to see what role it plays. - Compare and investigate personalized and non-personalized results to ensure they’re working as expected.
- Repeat this for as many search queries and users as you would like. The more queries and users you test, the more confident you can be in your strategy.
- If the results aren’t what you expect, adjust your strategy accordingly. For example, you may find that a boosted result isn’t boosted enough. In that case, you can increase the Personalization impact. Or, you may find that a result you wouldn’t expect to be boosted is. Through further inspection, you can see it’s because a particular facet is playing too strong a role in the Strategy. In that case, you can lower the facet’s weight or remove it altogether.
- Once finished, select Discard or Save settings.
Inspecting user affinity profiles
Algolia computes an individual user’s affinity profile based on their behavior that you’ve captured as events during the last 90 days. Algolia applies this user affinity profile as a set of scored filters when personalizing results.
The affinity scores depend on both the number of times the user performed the behavior and each behavior’s corresponding event’s weight as defined in the Personalization strategy. Affinity scores quantify the preference a user has shown for a given facet value. The higher the score, the higher Personalization boosts matching records at query time.
You can inspect individual user affinity profiles in the User tab of the Personalization section of the dashboard. You can either enter the specific userToken you’re looking for or select one from the recently active userToken suggestion list.
The dashboard displays the Profile history for the selected user, including the date of their last received event, and their Profile affinity. The Profile history shows a bar graph of the total number of received events for each event for the given userToken over the last 90 days.
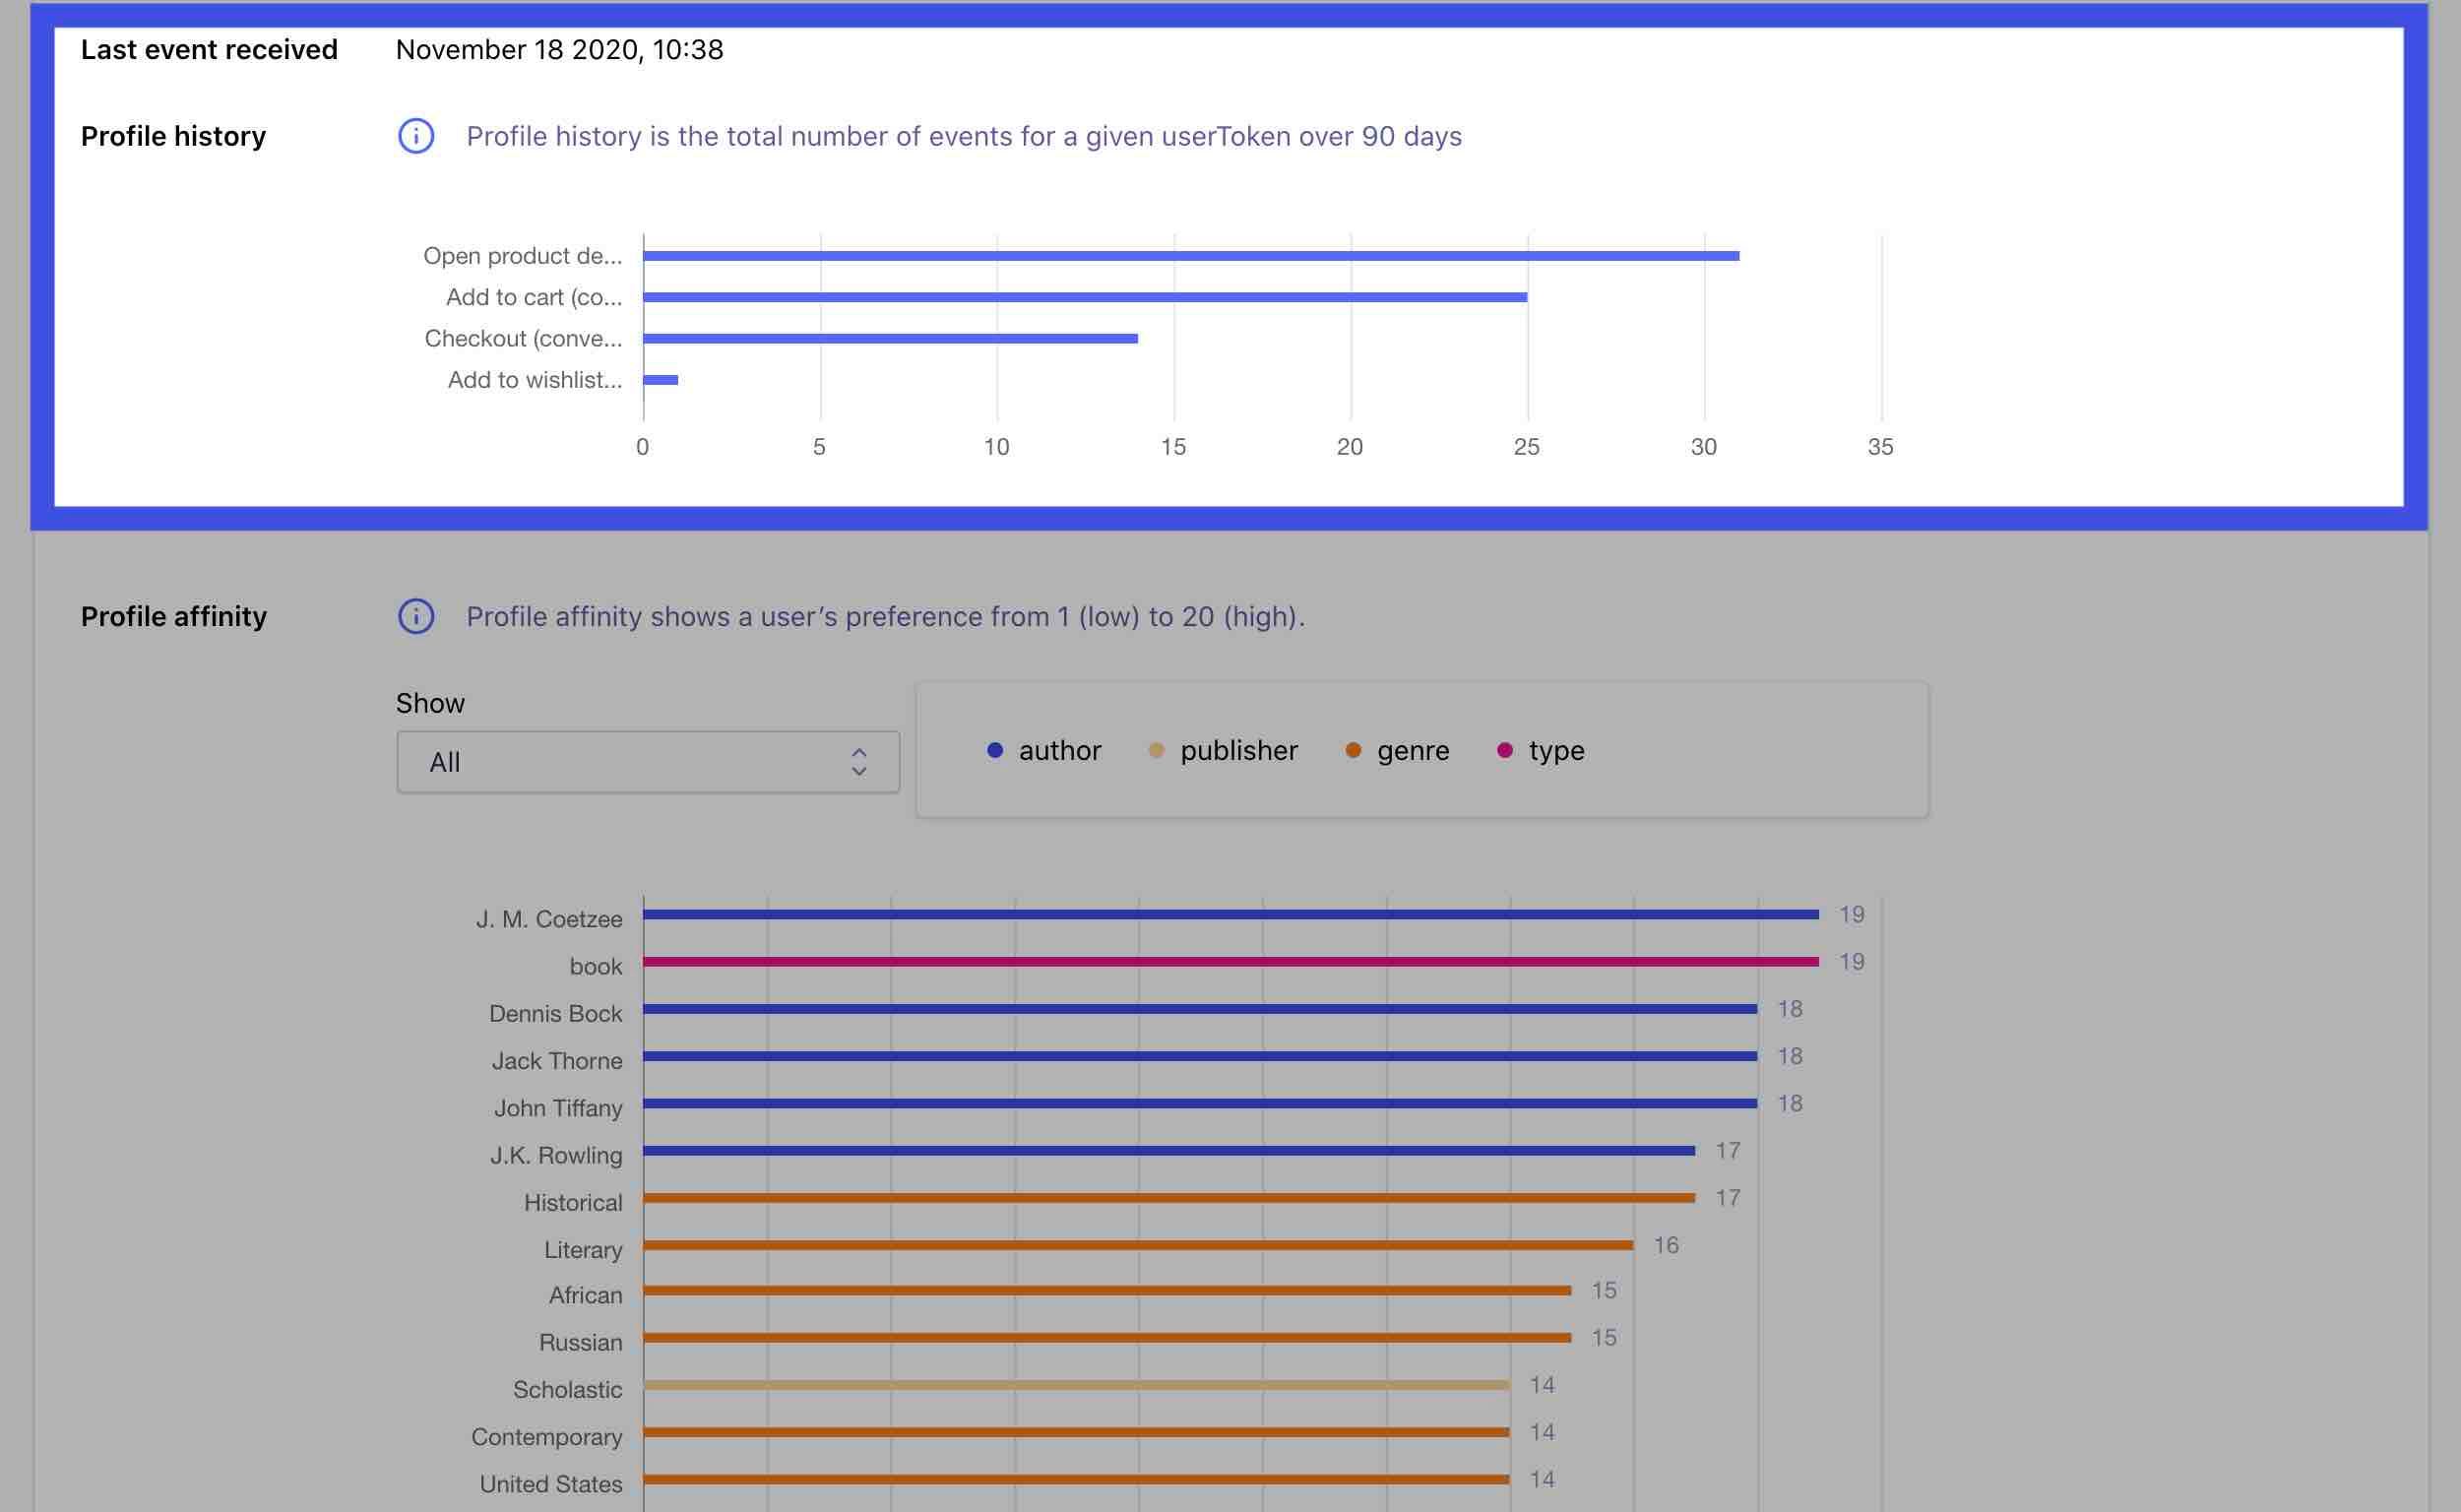
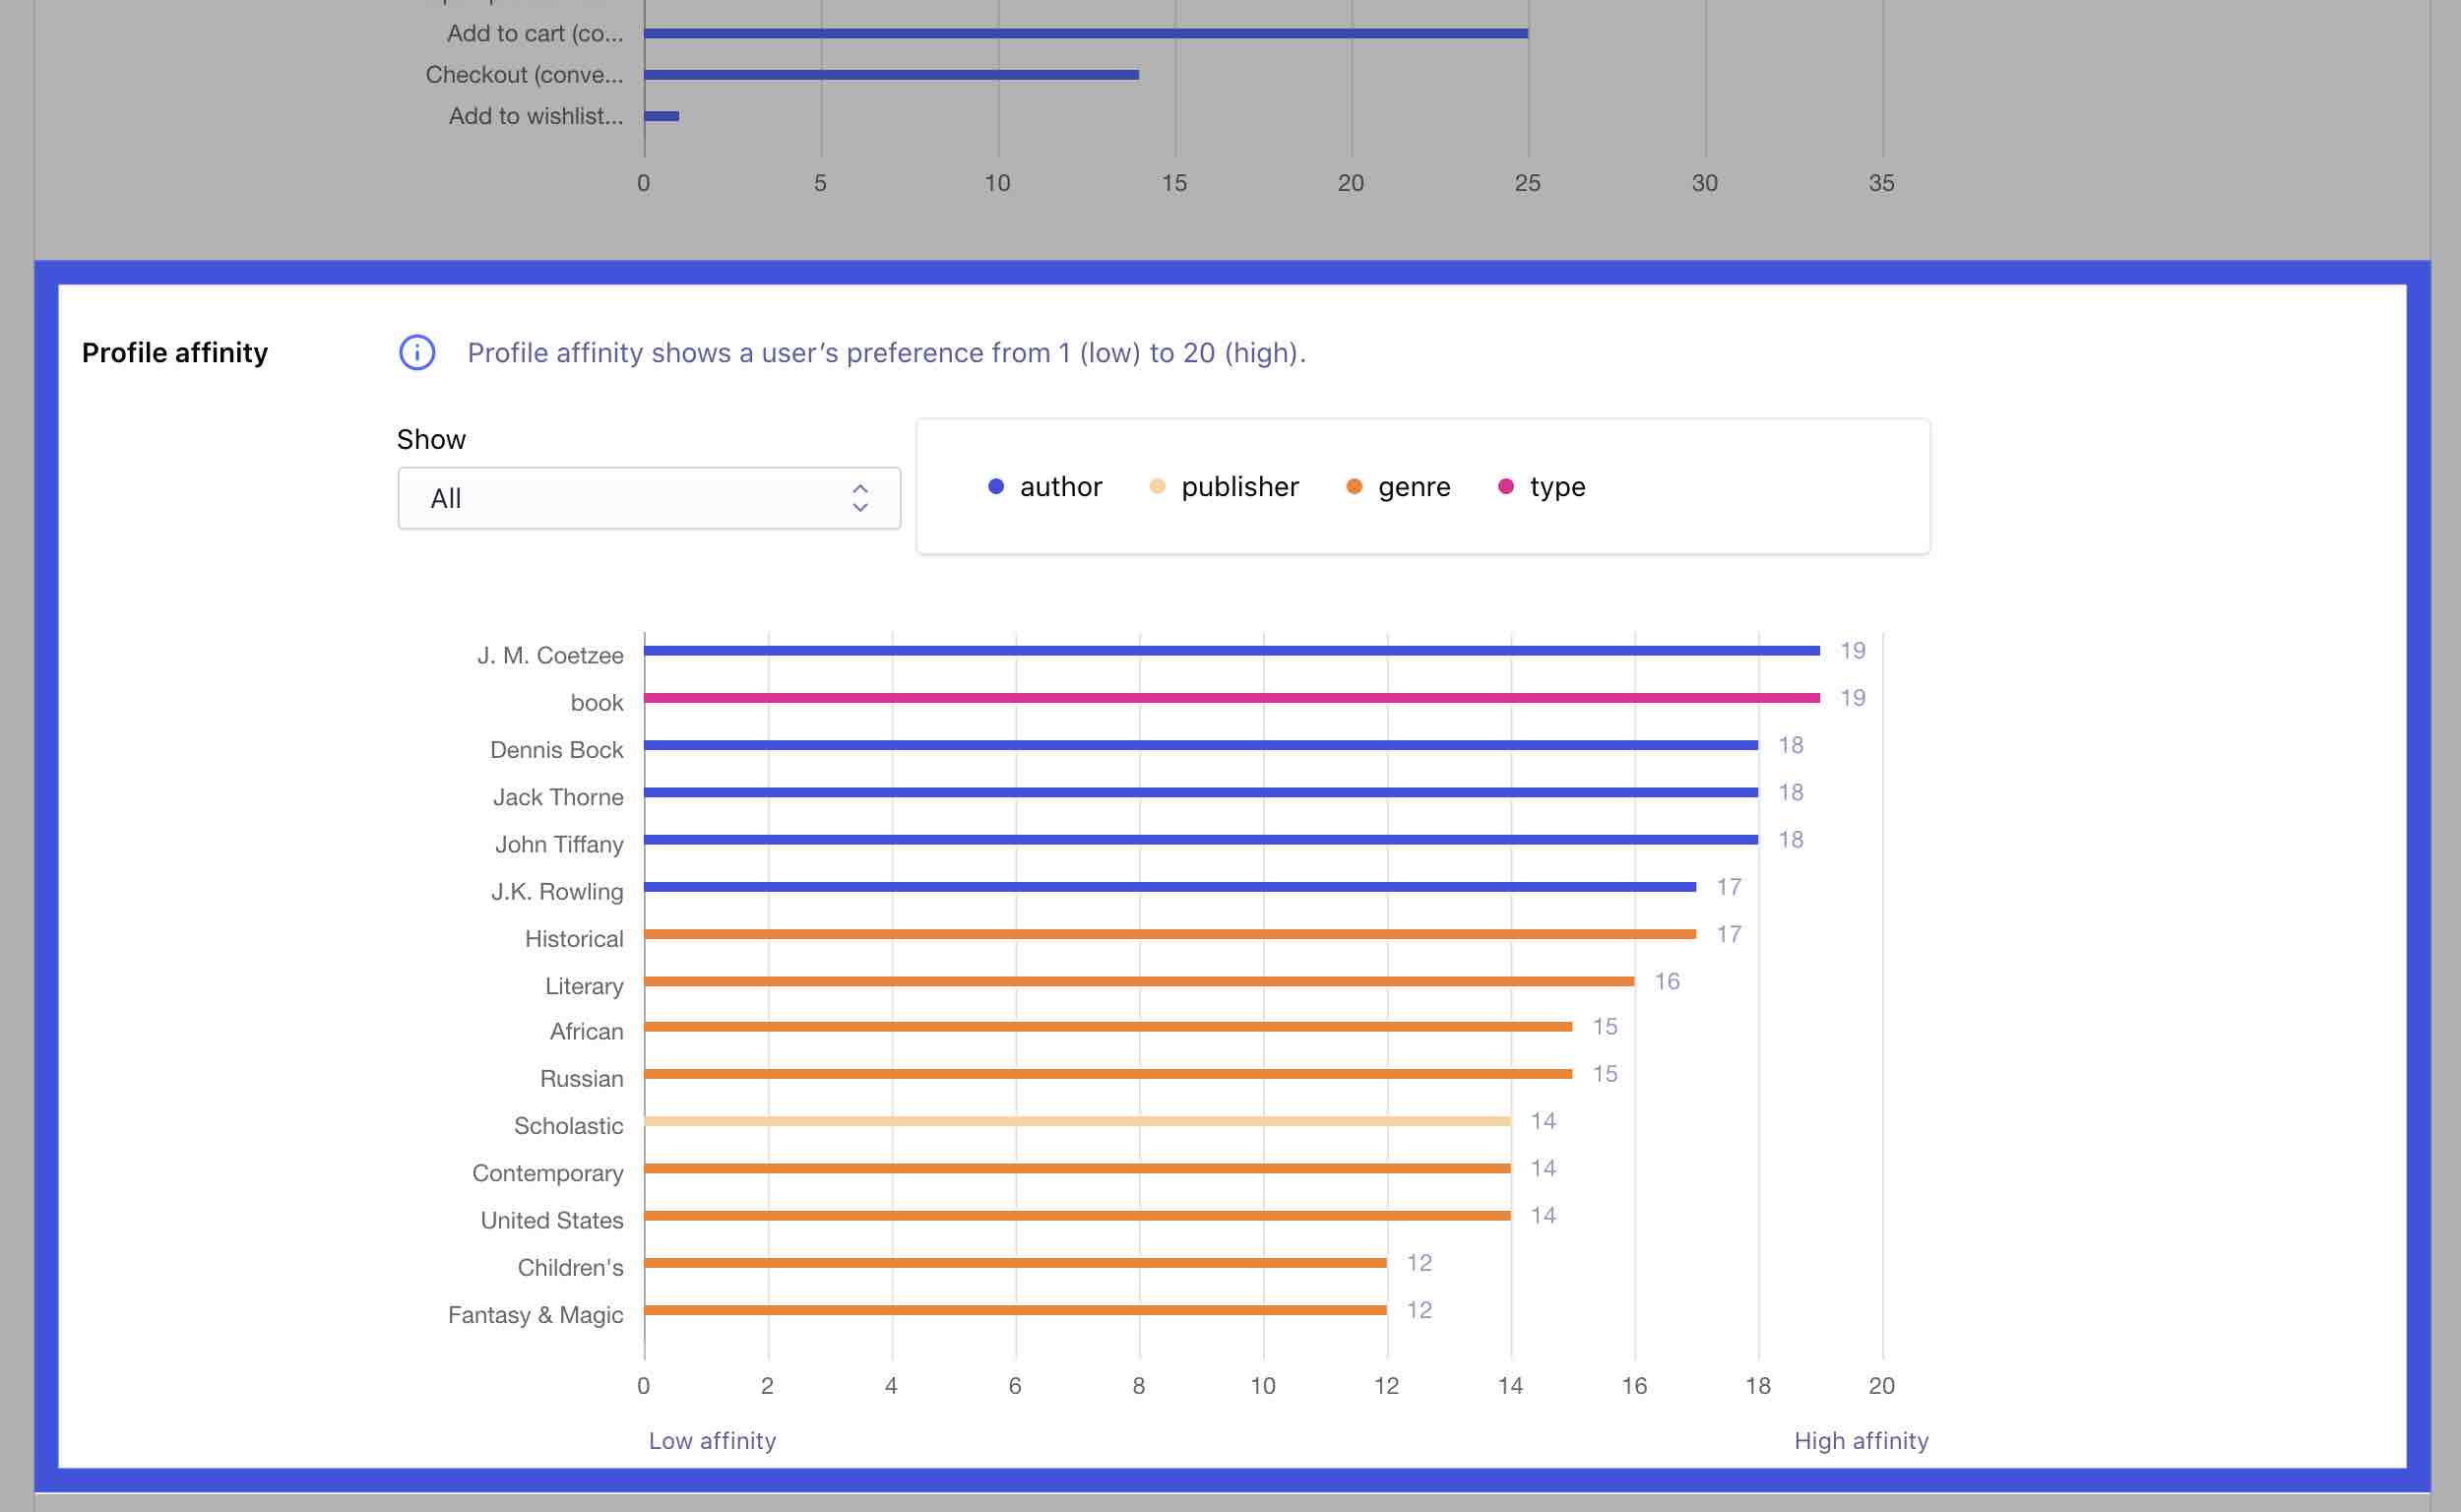
The Profile affinity shows facet values a user has shown an affinity towards based on received events. You can choose to see all known affinities or focus on a particular facet’s values by selecting it from the Show dropdown.
You can also access user affinity profiles via the Recommendation REST API if you want to store profiles or use them for personalization purposes outside of Algolia.
