Get Started Using the Dashboard
On this page
Algolia’s dashboard is an interface for accessing your data and index configuration.
- If you’re a developer, you can use the API clients to access Algolia’s complete feature set and take more dynamic control of your application. However, to quickly test your data, you can do an initial import using the dashboard.
- If you’re a project manager or other non-technical user, you can use the dashboard to tweak index configuration settings after importing data.
Most dashboard features are available from the API. The API is often the more flexible method since it provides features not available on the dashboard. You can also save different versions of your configuration in your code, making it easier to compare different configurations.
To get to the dashboard, log into Algolia’s website, using your sign-up details, and click the dashboard link on the upper right corner of the home page.
Dashboard navigation
The sidebar contains the dashboard’s main navigation. If you have a multi-application environment, you can switch between your applications by clicking on your current application ID and then selecting one of your applications from the dropdown. You can also create new applications from the dropdown.
Overview
Listed below your current application ID are the following sections:
- Overview
- Indices
- Analytics
- A/B Testing
- Query Suggestions
- Monitoring
- API Keys
- Infrastructure
- Team
- Personalization (if part of your plan)
- Billing
There are additional links at the bottom of the sidebar to access your account settings, send feedback, go to the documentation, or reach out to support.
Overview
The dashboard’s Overview section features a snapshot of your account status. You can see search metrics, usage information, and a complete list of your indices alongside their record count.
Indices
The Indices section allows you to manage the configuration of your indices. From here, you can import data, create new indices, configure indices, set up Rules, manage replicas, and generate a site demo.
There are several tabs on the Indices page, which you can access through the bar near the top of the page:
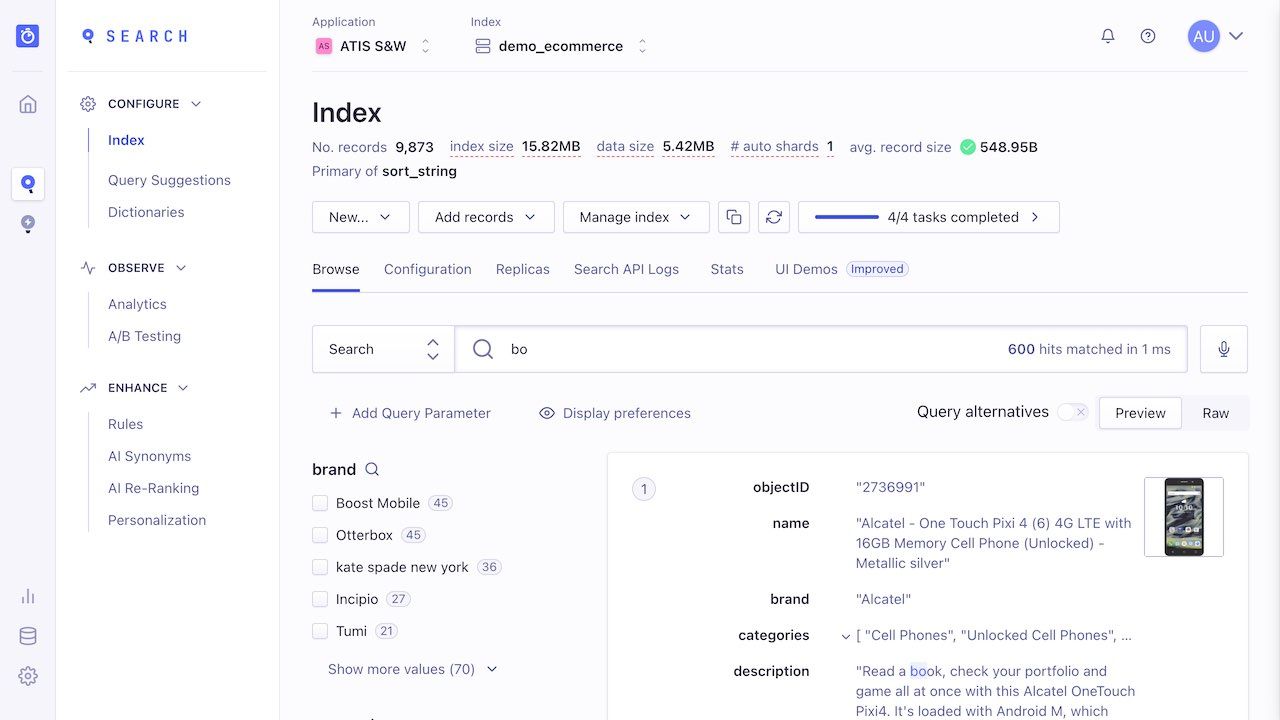
Browse
The default tab of the Indices page is Browse. From the Browse tab, you can test the search configuration of your index. You can debug specific search results by hovering over the trophy icon attached to each record. This explains the ranking position of your records.
Configuration
From the Configuration tab, you can change the settings of your index. There are five important sections in this tab:
- Relevance Essentials, which lets you configure searchable attributes, ranking and sorting, personalization (Premium plans only), and AI re-ranking (Premium plans only).
- Relevance Optimizations, which lets you configure typo-tolerance, language, synonyms, stop words, segmentation and decompounding, special characters (like diacritics, separators, and custom normalization), exact matching, and word proximity.
- Filtering and Faceting, which lets you configure your facets. You can set any attribute as a facet, but the dashboard’s dropdown doesn’t necessarily show all possible attributes. You can type the name of any attribute present in your records, even if it doesn’t show up in the list.
- Pagination and Display, which lets you configure pagination, highlighting, and snippeting.
- Search Behavior, which lets you configure retrieved attributes, prefixing, deduplication and grouping, no results behavior, and advanced syntax.
Rules
You can create, edit, and delete Rules.
Only available if Rules are part of your plan.
Replicas
On the Replicas page, you can create replica indices.
Search API logs
On the Search API logs page, you can see the last 1,000 calls you’ve made to Algolia’s API. Using the tabs at the top of the page, you can view search requests, build requests, or failed requests separately. You can’t see logs older than seven days because they get deleted automatically. The page only shows API calls for the current index. If you’re looking for the logs for all indices, head over to the Monitoring section.
Stats
On the Stats page, you can view graphical representations of your record count, search operations, operations, and search response time.
UI demos
On the UI demos page, you can generate and share a website that contains your data with an Algolia search configuration.
Analytics
The Analytics section lets you analyze your users’ search behavior. You can track top searches, the number of hits, searches with no results, searches by country, and filter use.
It’s good practice to complement this information with other analytical tools or API calls. By doing so, you can monitor key metrics such as conversion rates.
For more on this subject, review the Analytics guide.
A/B Testing
The A/B Testing section lets you perform A/B tests and analyze their results. Check out the A/B testing guidance for more information.
Query Suggestions
The Query Suggestions section lets you implement the necessary back end tasks for Query Suggestions.
Monitoring
The Monitoring section lets you view and analyze the performance of a specific application of yours. You can view usage, API calls, search performance, the status of your servers, the status of your Algolia services, and enable email or phone alerts.
API Keys
The API Keys section lets you manage your API credentials. You can see all the API keys for the application selected in the sidebar. You can also generate new keys for this application. To learn more, refer to the page on API Keys.
All these keys must be kept secure: they could give access to your data, settings, and analytics.
Infrastructure
The Infrastructure section is only available for plans with the Enterprise add-on. It lets you track latency: the speed at which your users get search results.
The default section, Distributed Search Network (DSN), features a world map broken down by region, which allows you to see where your users are in relation to your servers.
You can see how long the average search takes in milliseconds for each region. The larger the distance between your servers and your users, the slower their search experience.
If too many of your users are in a region where the latency exceeds 100 ms, you might want to relocate or duplicate your data into other regions. You can do this with the DSN service.
There is also an Analytics subsection, which lets you select which regions generate your analytics data.
Team
The Team section lets you add team members and specify what parts of your Algolia application they can access.
Personalization
The Personalization section lets you provide your users with a personalized search experience. You can learn more about this process in the Personalization documentation.
Billing
The Billing section contains all the billing information associated with your account and plan.