Analytic Metrics and Reports
The Analytics section of the dashboard contains metrics that help you better understand your end users’ search-related activity. This page outlines those metrics and the different tabs of the Analytics dashboard.
Dashboard metrics
The metrics in the Overview tab and others come in two categories: out of the box metrics and click and conversion metrics. Click and conversion metrics only appear if your plan includes Event Analytics and if you’ve implemented event tracking.
All metrics on all tabs are index specific. If you’re seeing unexpected metrics, make sure you’ve selected the correct index and Date range. You can toggle Include all replicas to aggregate replica index analytics.
Out of the box metrics
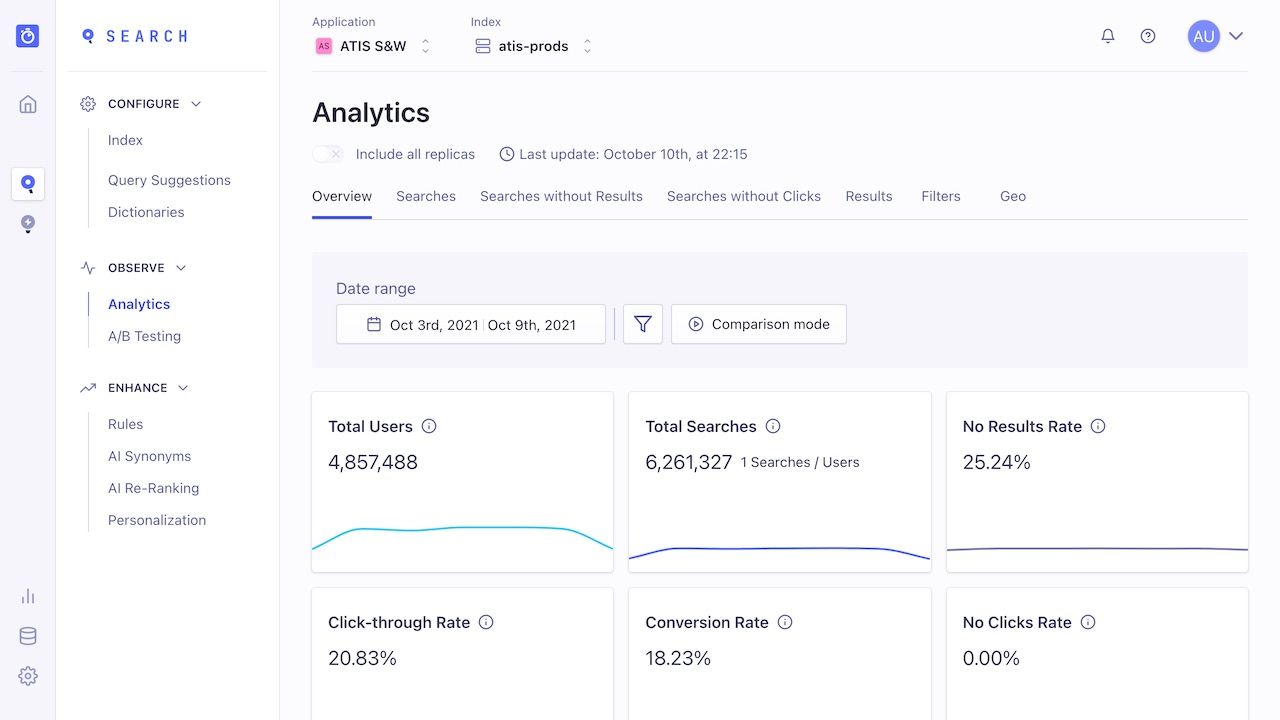
Total Users
- How many unique users performed a search. If you implemented search from your back end, you need to forward the end users IP address.
- One IP address counts as one user.
Total Searches
- How many searches were performed.
- As-you-type searches are aggregated. For example, “i” → “ip” → “ipa” → “ipad” counts as one search.
- The aggregation time frame is 30 seconds. For example, “i” → “ip” → “ipa” → 30 seconds → “ipad” counts as two searches—one for “ipa” one for “ipad”.
- Searches passed with the
analyticsparameter set tofalsearen’t counted. The Browse tab of the Algolia dashboard includesanalyticsparameter set tofalseby default.
No Results Rate (%)
- The percentage of searches that returned no results.
- No results means that the Algolia API sent a JSON response containing no hits.
Click and conversion metrics
By looking at click and conversion metrics, you can discover and avoid lost opportunities. An example of a lost opportunity is a best-selling items that has a low click through rate because it appears too low in the search results.
Lost opportunity analysis shows you how to fine tune your search and your products. It can give you direction in improving your relevance settings, rewriting product descriptions, and updating your catalog.
Click and conversion metrics are only available after implementing Click and Conversion Analytics. Otherwise, you see No tracked searches under the click and conversion metrics.
If you’ve implemented Click and Conversion Analytics and still aren’t seeing any click and conversion metrics, it may be because they aren’t being sent properly. For a click or conversion event to count towards click-through-rate and conversion rate, you must include the queryID as part of the event payload. For more information, please see the FAQ on why some click events aren’t used for click analytics.
Click-through Rate (CTR) (%)
- The percentage of tracked searches (searches with
clickAnalytics:true) you sent at least one click event with the associatedqueryID - The number of tracked searches resulting in a click / total number of tracked searches.
- If a single search generates multiple click events, it doesn’t effect conversion rate differently than if the search generates one click event. When calculating click through rate, each search’s click metric is a yes or no metric—did the search generate at least one click or not?
Conversion Rate (CVR) (%)
- The percentage of tracked searches (searches with
clickAnalytics:true) where you sent at least one conversion event with the associatedqueryID. - The number of tracked searches resulting in a conversion / total number of tracked searches.
- If a single search generates multiple conversion events, it doesn’t effect conversion rate differently than if the search generates one conversion event. When calculating conversion rate, each search’s conversion is a yes or no metric—did the search generate at least one conversion or not?
- Conversion events and clicks events are independent. A conversion isn’t linked to a click, only a
queryID. Hence you can have conversions without clicks.
Conversion considerations
The conversion rate for an individual query measures the percentage of searches that led your users to take a conversion action. How you define conversions is up to you. Suppose you define “adding an item to the cart” as a conversion event. The conversion rate lets you measure what percentage of searches for “t-shirt” led to adding items to the cart.
While you should send as many types of click and conversion events as are meaningful for your use case, Algolia calculates one overall click-through rate and one overall conversion rate.
No Click Rate (%)
- The percentage of tracked searches (searches with
clickAnalytics:true) that return at least one result but never generate clicks. - Calculated based on unique queries. A search is included only if its query never generates any clicks in the given time range.
- The number of tracked searches with a query that never results in a click / total number queries in tracked searches.
For more information, please see the FAQ on why click-through-rate (CTR) and no-click-rate don’t add up to 100%.
Click Position
The average position of the clicks performed on the search results. Smaller values are better since they indicate that users tended to click higher up in the results.
For example, suppose there are the following clicks for the query
“ipad”:
- 2 clicks on the first result
- 1 click on the third result
- 1 click on the tenth result
The average click position is (1 + 1 + 3 + 10) / 4 = 3.75
Dashboard tabs
Each of the dashboard tabs present data in a way to draw specific insights. Most of them present the data in tables that you can sort by clicking on headers. For Searches, Searches without Results, Searches without Clicks, and Results, you can search for a particular search term or result to see its metrics.
For all tabs except Geo, you can select the Download button on the top right of the table to download the data as a CSV or XLSX file.
Click and conversion metrics are only available after implementing Click and Conversion Analytics. Otherwise, you see – under the click and conversion metrics on these tabs.
Searches
This tab shows:
- Query - the most popular query terms
- Count - the number of times they’ve been searched for
- CTR - click-through rate
- CVR - conversion rate
- Click Pos. - the average click position
- Total Searches - the percentage of all searches made up by this query term
By default, the UI sorts searches by count. This tab can help you understand what your most popular search terms are and how each is performing.
When you click on a search term, you can see it’s Average click position and a click position histogram, in addition to the previously listed metrics. You can also see if any Rules were applied, and which filters, if any were used. Finally, you can see what the results for the search term are.
Popular search data helps you re-examine product vocabulary by seeing which words your users tend to use. You can align their vocabulary with that of your database. For example, if “sofa” is searched for more frequently than “couch”, your database needs to support both “sofa” and “couch”. You can do this by adding attributes or using synonyms.
One of your most popular searches may be <empty query>. With some coding, you can prevent <empty query> from showing up in your analytics.
Searches without Results
This tab shows:
- Query - the most popular query terms that led to no results
- Count - the number of times they’ve been searched for
- Total Searches - the percentage of all searches made up by this query term
Searches without Results is a subset of Searches and you may see some search terms appear in both tabs. The difference is that Searches without Results only includes searches that yielded no Algolia hits.
When you click on a search term, you can see if any Rules were applied, and which filters, if any were used.
By seeing the most frequent searches that lead to no results, you can adjust either your catalog or relevance. If top searches with results point out a true gap in you offerings, you may want to expand your catalog. If the search terms point to something you already have, but that your users are having trouble you can add synonyms or Rules to help them find it.
If you add a Rule to show a banner for a particular no results search term, you still see it in your Searches without Results since it isn’t retrieving any records from your index.
Searches without Clicks
This tab shows:
- Query - the most popular query terms that had a 0% CTR
- Count - the number of times they’ve been searched for
- Total Searches - the percentage of all searches made up by this query term
Searches without Clicks is a subset of Searches and you may see some search terms appear in both tabs. The difference is that Searches without Clicks only includes searches that yielded no clicks.
When you click on a search term, you can see if any Rules were applied, and which filters, if any were used. You can also see what the results for the search term are.
Like Searches without Results, Searches without Clicks shows you underperforming queries. These may yield results, but never any clicks. You may want to add synonyms or Rules to boost results that your users would find more appealing.
Results
This tab shows:
- Results - the most popular results returned across all searches
- Count - the number of times they’ve been returned
- CTR - click-through rate
- CVR - conversion rate
This tab lets you see which records your users see most often in their search results, and how they’re performing. By default, the tab displays a records objectID, but you can change this by click Displayed attributes and selecting the desired attributes.
Filters
This tab shows:
- Top filtering attributes - the attributes users filter on most, for example, “color,” “category,” “brand,” etc.
- Popular values per filter - the attributes values users filter with, for example, “red,” “yellow,” “purple” etc. You can select which filtering attribute (for example, “color”) you want to see the values for.
You can use these analytics to improve your faceting configuration. For example, if your users are filter on the “size” and “color” attributes, but not your brand one, then you can remove your brand filter or display it lower on your page.
The same goes for filter values: if the colors red and yellow are used more often than purple, you can adjust your inventory by stocking less purple items, or adjust your index settings by favoring or promoting red and yellow over purple.
Geo
This tab shows the geographical origin of the searches, and the associated network latency.
Metrics that tie search to location can help you learn about who your users are and where they come from. Understanding latency can help you better choose where to place your servers and DSNs.
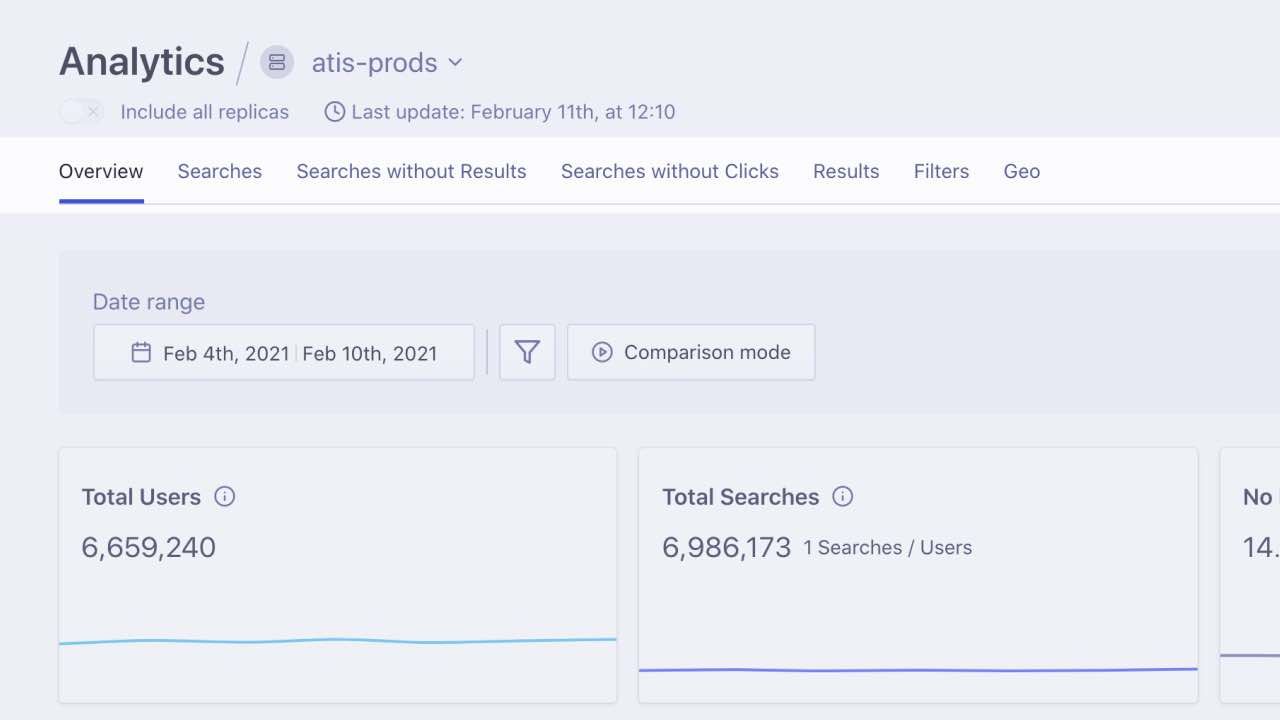
Comparing analytics between periods
On all tabs including the Overview tab, you can use the dashboard to compare analytics from different date ranges. To compare one date range to another, choose a start and end date for your first date range, then select Comparison mode. Then you can select the start and end date for your second date range.
Comparison mode lets you see metrics for your selected periods and their percentage difference.
You can compare analytics from different days, weeks, months, or use a custom time range.