Create and Run an A/B Test
You can create new tests on the dashboard. Here’s what the process looks like:
Set up the test
Some of the instructions below only apply to A/B testing with two different indices. You can ignore those parts if you are doing A/B testing on a single index.
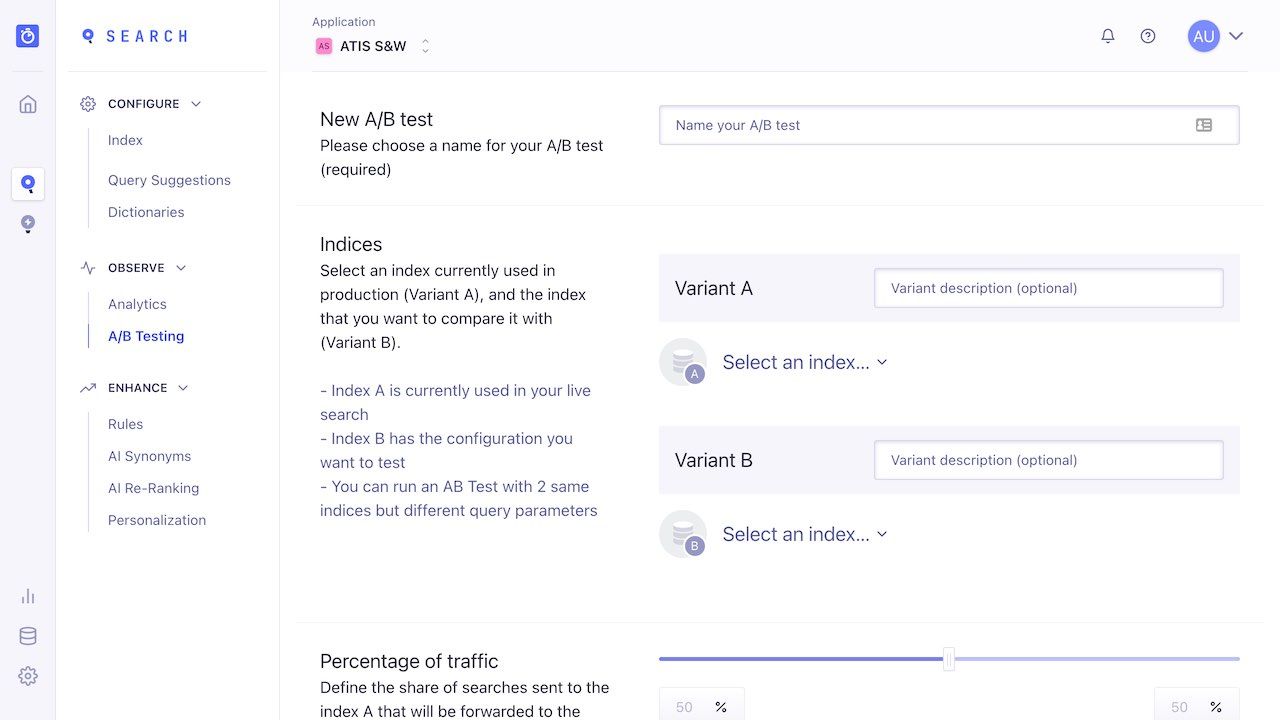
You need to provide four pieces of information to get a test up and running:
-
The test name: when creating your test, always use descriptive names so you can easily understand the purpose of the test. For example, if you are comparing the “most-viewed” and “most-sold” sort orders, a good name would be “Which is better - most-viewed or most-sold?”.
-
Your A and B indices: A is the control index, your main index. B is your comparison index. The A and B indices are referred to as scenarios. Each index should return different results. You can set a description for each index: make it readable so that you can understand, at a glance, the nature of the scenario.
-
The percentage of traffic for A and B: you might want 50% of your searches to use index A and the other half to use index B. Or you might want your test to use B less often, especially if you are unsure about the change. If this is the case, you can allocate a lower usage to index B; 30% for example, making the split 70/30.
-
The test duration. The correct duration for your test is mathematically determined. For results to be reliable, your test requires a certain amount of data. We determine this minimum amount using a 5% significance level, indicating 95% confidence. You can choose to run your test from 1 to 90 days. Normally, you should set a duration that you estimate is more than enough time to reach confidence. What you choose depends on your average usage: low-usage sites need to run their tests longer than high-usage websites.
Starting your A/B test
Pressing “Create” starts your A/B test. Once a test is created, it starts running immediately. At this point, you can either stop the test before its planned duration (but be careful, you cannot restart it!), or wait until it is completed.
You cannot pause a test because doing so would undermine the accuracy of the data: full, continuous testing, without outside interference, is a necessary part of A/B testing.
View the results
You can view a test while it is running or after it has completed. Results are presented in tabular form, making it easy to see which of your indices is performing best. The results table shows the scores for each variant, how many users are involved in the test, and how reliable the test is (confidence percentage). Let’s take a look at an example:
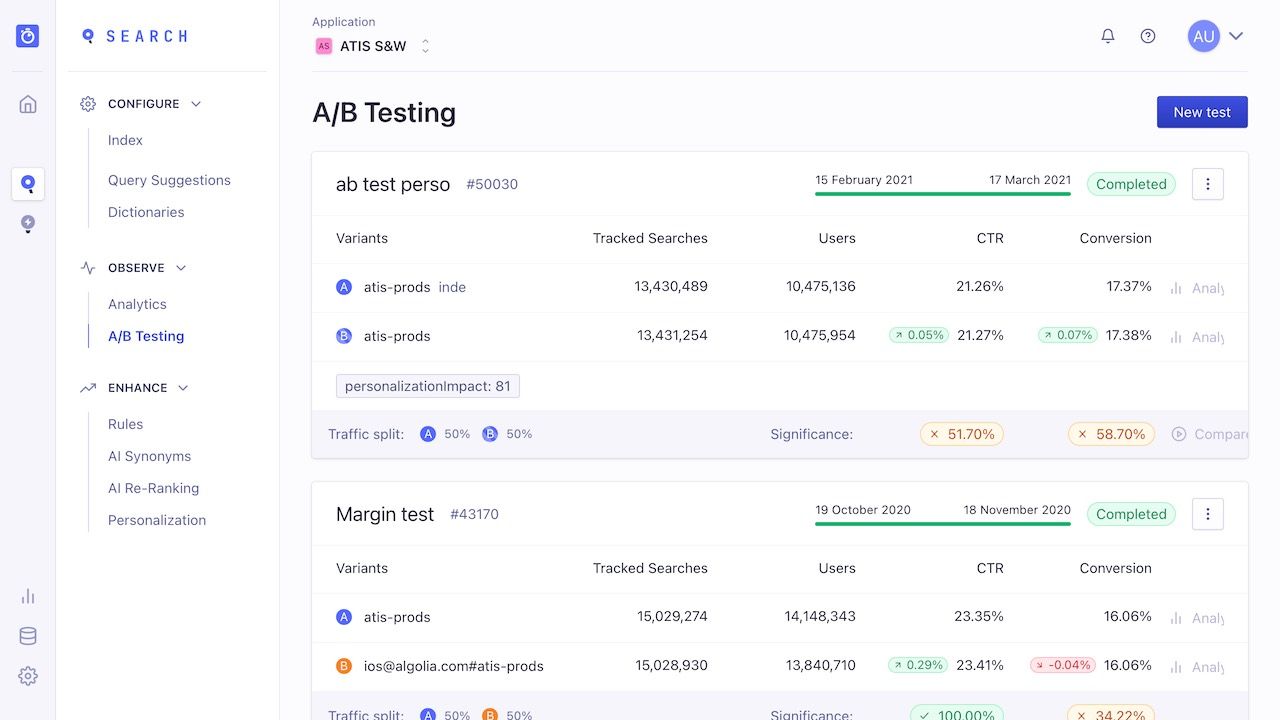
Each test is a block of 5 rows.
Descriptive elements: you see the titles and descriptions of your scenarios, as well as the allocation and duration choices you made in creating the test.
- The Menu: on the first row, top right, you can stop a test. You can also delete the results.
- Status: to the right of the menu, you can find the status of the test. Possible statuses are:
Newfor a recently created test,Stopped,Finished, orRunning(along with how many days are left).
Data Columns/Rows:
- Searches and users: these figures indicate the sufficiency of the data and the fairness of the allocation.
- Click-through and Conversion rates: these figures create the performance comparisons, showing whether index A or B is providing better results.
- The difference: the red or green arrow (and percentage number to the left of the rates) clarifies the comparison. Performance comparison is not a simple subtraction: taking the percentage difference between the 2 scenarios offers a better comparison. In our example image, the B scenario appears to be doing better in both categories (5.2% better in CTR, and 4% better in Conversion rate).
- Confidence percentage: the final row contains the confidence percentage, which tells you whether a test has reached its threshold of reliability (ie, statistical significance). You should wait for 95% confidence before relying on the results. One test may reach the confidence threshold before the other. It is up to you, in all cases, to decide how long you wait before stopping the test.
For more about these numbers, see interpreting results as well as how we calculate the scores.
Note: test results are updated every 5 minutes. Analytics data is sent in real time, but the dashboard only refreshes once every 5 minutes. Therefore, you won’t see changes in real time.
Test Statuses
A test can be in 3 states:
- Running: the test is active.
- Stopped or Finished: in both cases the test is over and cannot be restarted. Your application is back to normal: index A performs as usual, receiving 100% of search requests. When you stop a test, all associated metadata and metrics are stored, and the test remains on the Dashboard.
- Deleted: when a test is deleted, all associated metadata and metrics are stored, but it disappears from the Dashboard.
Interpreting results
See also math and statistics methodology.
What you consider good or bad is entirely dependent on your website and business. You need to compare the cost of an improvement with its benefits. A 4% improvement of CTR might not be convincing or profitable enough to warrant a change to the structure of your records.
It’s the same with conversion rates: we can’t tell you what a good conversion rate improvement is for your application. That said, because changing settings or pushing different data is usually a low-cost option, you should almost always implement any possible improvement.
Minimum number of searches
Although strongly discouraged, you can stop your tests whenever you want. You can analyze results on as little or as much data as you want, ignoring our statistical confidence indicator.
There is underlying math behind this indicator. It uses a methodology that ensures confidence and reliability. In other words, respecting the indicator protects you from jumping to conclusions too early based on skewed or insufficient data.
Quantifying variant performance
A small increase in CTR or Conversion can cause a large jump in sales and traffic; and improve customer success and fidelity. So once a test has received sufficient usage, and the conclusion is positive for B, don’t hesitate to act on those results!
Best Practices
-
Test before going live: Be wary of breaking anything. For example, make sure that both your test indices work smoothly with your UI. Small changes can break your interface or strongly impact user experience. For example, making a change that affects facets can fail the UI facet logic. Or changing a simple ranking on index B can make the search results so bad that users of this index will have terrible results. This is not the purpose of A/B Testing. Index B should theoretically be better, and if not, at least as good as index A.
-
Don’t change your A or B indices during a test: do not adjust settings during testing. This pollutes your test results, making them unreliable. If you must update your data, do so synchronously for both indices, and, preferably, restart your test. Changing data or settings during a test can break your search experience, and undermine the conclusions of your test.
-
Don’t use the same index for multiple A/B Tests. You cannot use the same index in more than one test at the same time. You will get an error.
-
Make only small changes: The more features you test simultaneously, the harder it is to determine causality.
The API
While you can run and leverage A/B tests directly from the Dashboard, some situations can benefit from testing directly with our API clients:
-
You want to run the same test across many indices, for example, if you have many websites using the same kind of indices but with different data. With the API you can create multiple tests more easily.
-
You want your backend to trigger tests based on data changes, or create feedback loops based on your analytics, as used in machine-learning. This is an advanced method of managing product-line changes or industry trends and should be done carefully.
These are unique use cases. We expect the majority of our clients to use the Dashboard to manage A/B tests.
Note, to use the API, your API key ACL must include:
- A/B Test creation/deletion - setSettings on all indices
- A/B Test analytics - analytics on all indices
