Out-of-the-Box Analytics
On this page
Out-of-the-box Search Analytics helps you model your users’ behavior by breaking down their searches into many metrics, like popular searches, number of searches with no results, and filter usage. The goal of Search Analytics is to help you make data-driven decisions when building and improving your search experience.
Collecting Search Analytics requires no extra effort on your side—there’s no coding involved. It’s also transparent to your users: in the background, Algolia gathers large amounts of search-related analytics, capturing data with every search.
From a technical point of view, Search Analytics can help you think more objectively about how to structure your product data, and how to configure your ranking and relevance. They can also lead you to use more advanced API settings to improve your users’ search experience.
For your business, there are an unlimited number of benefits. You can see whether your products are properly described or represented, whether the correct products show up in your search results, and whether, based on the searches, you have too much of one product and not enough of another.
What do Search Analytics measure?# A
- Overall search counts
- A “No search result” rate
- Top searches
- Top searches with no results
- Top results
- If a filter is provided, top searches associated with that filter
- Top filter attributes and filter values
- Distinct count of IP addresses / Users
- Top countries
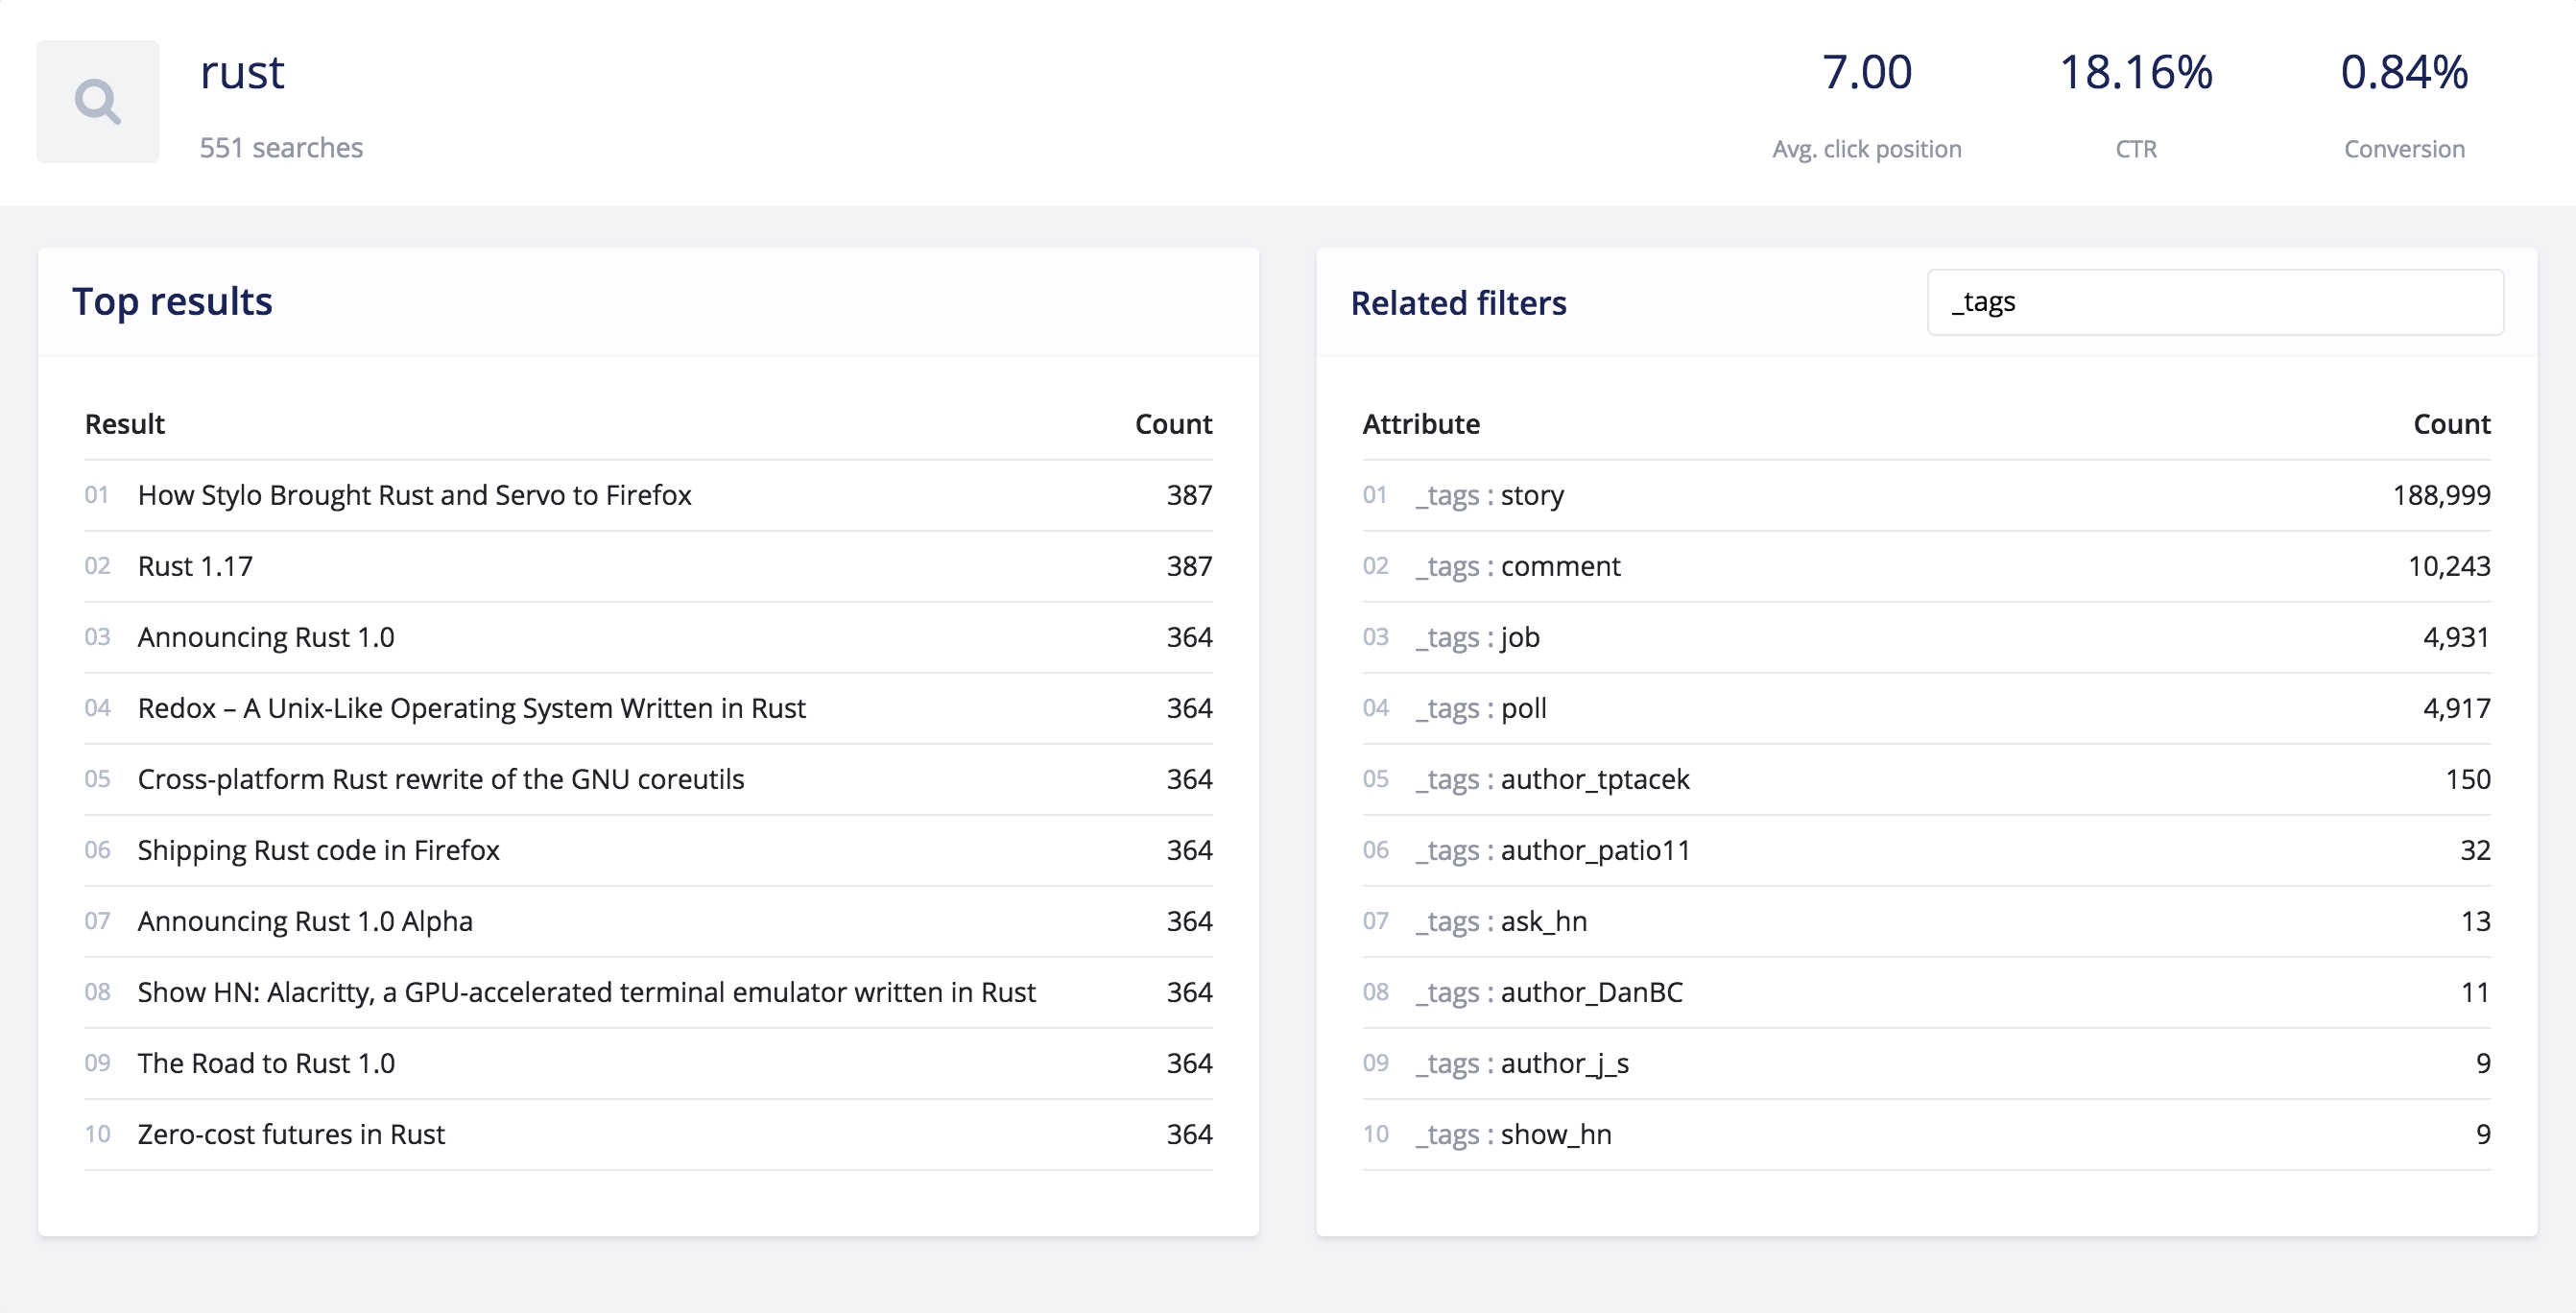
Here’s an example of what you can expect to measure with Search Analytics:

Which searches are captured?# A
Differences between queries and search terms in the analytics#
There’s a difference between the number of queries executed in the search engine and the number of queries stored by the analytics engine. Generally, you execute more queries than the analytics store.
The Algolia search engine is designed to execute queries at each keystroke. Every keystroke triggers a new query in the search engine. The analytics engine uses different logic. To have relevant analytics data, it ignores initial keystrokes and keeps only the latest, or final query that the user types.
For example, if a user types in “beatles”, the search engine performs seven queries: “b”, “be”, “bea”, “beat”, “beatl”, beatle”, and (finally) “beatles”. The analytics engine only saves one query, the last one, “beatles”. In other words, it ignores the first six queries: “b”, “be”, “bea”, “beat”, “beatl”, and “beatle”.
This is called “prefix” or “keystroke” aggregation.
Empty queries in the analytics#
By default, every InstantSearch implementation shows your users results as soon as they land on a page with InstantSearch.
This happens by performing a search with an empty query. Empty query searches show up in your dashboard as <empty search>.
More on query aggregation#
To only store the final search term in your analytics, the analytics engine needs to aggregate the keystrokes. It does this based on different factors, such as edit distance, timestamp and most importantly the user ID. If you don’t provide a userToken parameter, the user ID defaults to the IP address that performed the search.
When you perform searches from your back end, the IP address is the one of your server. This means the analytics won’t be reliable if you don’t provide a unique identifier for the end user who’s performing the search. You can do this in two ways:
- Set the
X-Algolia-UserTokenheader to forward a user ID, or use theuserTokenparameter. The analytics engine uses this token to perform query aggregation and compute the user count. - Set the
X-Forwarded-Forheader to forward the users’ IP address. The analytics engine uses this IP as theuserTokenif you don’t provide one. The users’ IP address is also required for geolocation to work.
Without setting a userToken, query aggregations and thus most of the metrics aren’t properly computed.
Query normalization in the analytics#
To simplify the analysis of your users’ behavior, the analytics engine normalizes queries. The engine puts them in lowercase and removes diacritics. For example, statistics for the query “Beatles” are grouped with “beatles” because they return the same results, just like “café” and “cafe”.
You can avoid normalizing diacritics with the keepDiacriticsOnCharacters setting.
Accessing analytics data# A
The analytics engine automatically captures Search Analytics. There’s nothing you need to do, and it has no impact on the search speed.
Search Analytics appear on the dashboard about 10 minutes after they occur.
Using the dashboard#
All analytics data is accessible in graphical format via the Analytics section of the dashboard. It walks you through each metric. Everything is clickable, you can drill down on the metrics. There are also tooltips to help you navigate through this data.
Using the API#
While analytics are accessible from the dashboard, you can also use the Analytics API to retrieve the results of your Search Analytics for reporting.

